-
A
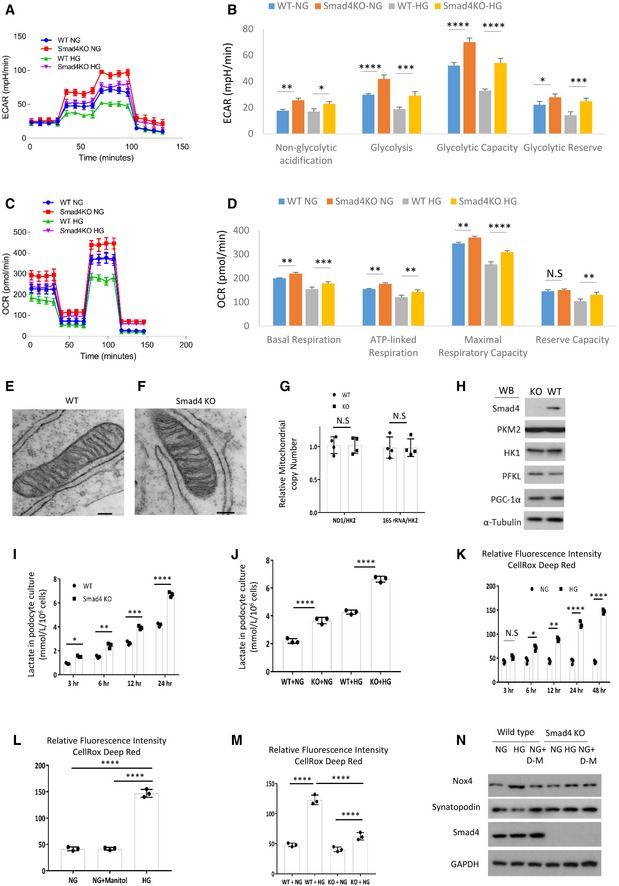
Wild‐type (WT) and Smad4 KO mouse podocytes were treated with normal glucose (NG, 1 g/l d‐glucose) or high glucose (HG, 4.5 g/l d‐glucose) for 24 h then Seahorse was performed. Seahorse demonstrated real‐time changes of ECAR in WT and Smad4 KO podocytes after treatment with glucose, oligomycin and 2‐deoxy‐D‐glucose (2‐DG).
-
B
Quantification of non‐glycolytic acidification, glycolysis, glycolytic capacity and glycolytic reserve.
-
C
WT and Smad4 KO mouse podocytes were treated with NG or HG for 24 h then Seahorse was performed. Seahorse demonstrated real‐time changes of oxygen consumption rate (OCR) after treatment with oligomycin, FCCP and rotenone in WT and Smad4 KO podocytes.
-
D
Quantification of basal, maximal, ATP‐linked respiration and reserve capacity.
-
E, F
Electron microscopy demonstrated mitochondria morphology in WT (E) and Smad4 KO (F) podocytes. Scale bars: 1 µm.
-
G
PCR demonstrated relative mitochondrial copy number in WT and Smad4 KO podocytes.
-
H
Western blotting demonstrated expression of Smad4, HK1, PKM2, PFKL, PGC‐1α and α‐tubulin in WT and Smad4 KO podocytes.
-
I, J
Lactate production in WT or Smad4 KO podocytes under high glucose (HG) and normal glucose (NG) conditions.
-
K
Relative fluorescence intensities of reactive oxygen species (ROS) under normal glucose (NG) or high glucose (HG) condition in podocytes.
-
L
Relative fluorescence intensities of ROS after 24‐h NG, HG or NG+ D‐manitol treatment in podocytes.
-
M
Relative fluorescence intensities of ROS after 24‐h NG or HG treatment in WT or Smad4 KO podocytes.
-
N
Western blotting demonstrated NOX4 and synaptopodin expression after 24‐h NG or HG treatment in WT or Smad4 KO podocytes.
‐test (G) or two‐way ANOVA (I, K) was performed. All values are shown as means ± SD of at least three independent experiments. N.S. not significant, *
< 0.0001.

