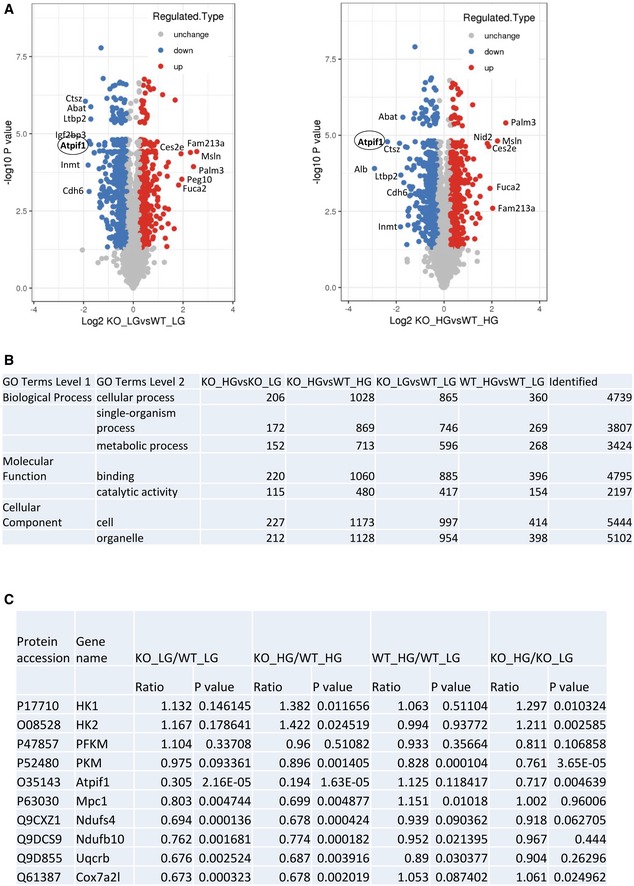
Figure 7. Quantitative proteomic profiling for wild‐type (WT) and Smad4 knockout (KO) mouse podocytes under normal glucose (NG) or high glucose (HG) treatment.

-
AVolcano plot of the protein abundance changes in response to NG or HG in WT or Smad4 KO podocytes. Average protein expression ratio of three replicates (log 2 transformed) between KO+NG versus WT+NG and KO+HG versus WT+HG. Different treatment groups were plotted against P‐value by t‐test (−log 10 transformed). Cut‐off of P = 0.05 and 1.3‐fold change were marked by blue and red dots, respectively.
-
BFunctional annotation of altered proteome in four experimental groups. A GO analysis of the significantly changed proteins identified in proteomic analysis for biological process, molecular function and KEGG pathway.
-
CThe figure shows protein accession number, gene name, ratio and P value in four experiment groups in quantitative mass spectrometry.
Source data are available online for this figure.
