-
A–C
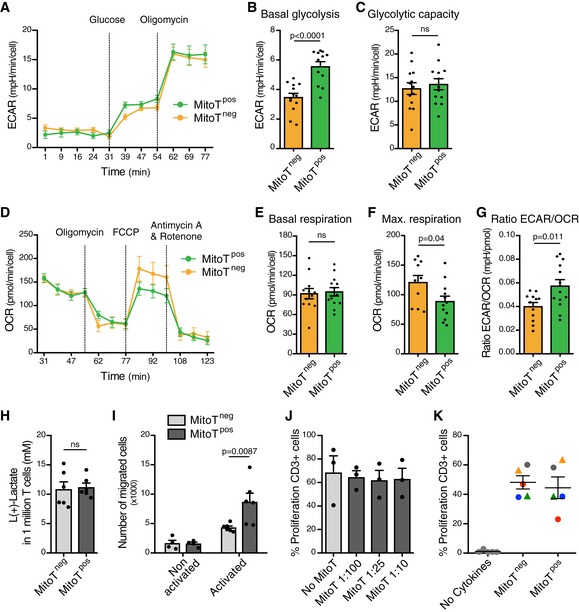
Extracellular Acidification Rate (ECAR) analysis measured in a Seahorse XFp extracellular flux analyzer in FACS‐sorted MitoTpos and MitoTneg CD3+ T cells mitocepted with UC‐MSC mitochondria (n = 3 biological replicates, ran in quadruplicates).
-
D–F
Oxygen Consumption Rate (OCR) analysis measured in a Seahorse XFp extracellular flux analyzer in FACS‐sorted MitoTpos and MitoTneg CD3+ T cells mitocepted with UC‐MSC mitochondria (n = 3 biological replicates, ran in quadruplicates).
-
G
Glycolysis/OXPHOS ratio on FACS‐sorted MitoTpos and MitoTneg CD3+ T cells mitocepted with UC‐MSC‐MT (n = 3 biological replicates, ran in quadruplicates).
-
H
L(+)‐Lactate concentrations from supernatants of sorted CD3+ MitoTneg and MitoTpos T cells, previously mitocepted with UC‐MSC‐MT (n = 2 biological replicates, each one in triplicate).
-
I
Number of migrated CD4+ MitoTneg and MitoTpos sorted T cells from 100.000 cells seeded on media non‐activated or activated with anti‐CD3 and IL‐2 for 3 days (n = 3 biological replicates, in duplicates).
-
J
Percentage of CD3+ T cell proliferation after increasing Mitoception ratios, quantified by measuring the corresponding decrease in CellTrace Violet (CTV) proliferation dye intensity by flow cytometry (n = 3 biological replicates with three different PBMC donors).
-
K
Percentage of proliferation of FACS‐sorted MitoTneg and MitoTpos CD3+ cells, after 5 days in culture with anti‐CD3/CD28 beads (1/20) and IL‐2 (50 U/ml) in the presence or absence of PHA (15 μg/ml) (round or triangle dots respectively) (n = 5 biological replicates with five different PBMC donors).
Data information: All graphs show mean ± SEM and statistical analysis by Student's
‐test.