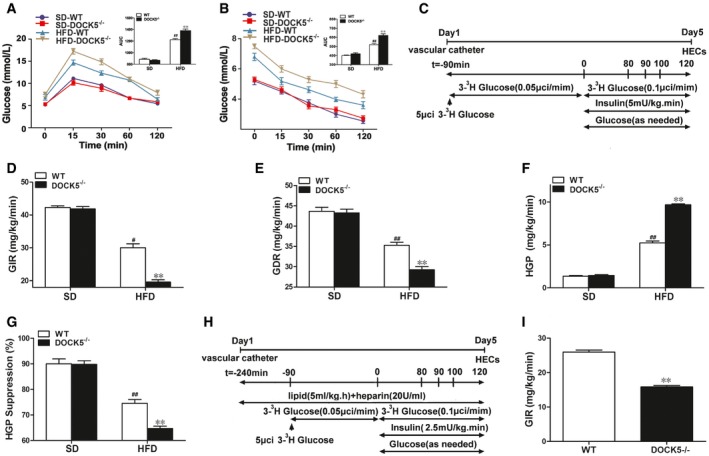
Eight‐week‐old male WT and DOCK5
−/− mice were fed a SD or HFD for 3 months.
Blood glucose levels and area under curve (AUC) during the glucose tolerance test.
Blood glucose levels and AUC during the insulin tolerance test.
Experimental procedure and hyperinsulinemic‐euglycemic clamp (HEC) protocol.
Glucose infusion rate (GIR).
Glucose disposal rate (GDR).
Hepatic glucose production (HGP).
Percentage of suppression of hepatic glucose production (HGP).
Experimental procedure for lipid infusion and the hyperinsulinemic‐euglycemic clamp (HEC).
Glucose infusion rate (GIR) during lipid infusion.
Data information: SD, standard chow diet; HFD, high‐fat diet; AUC, the area under the curve for glucose. Data are means ± SEM (
n = 5 or 6 mice for each group).
P‐values were determined with two‐way ANOVA,
#
P <
0.05,
##
P <
0.01 versus SD‐WT; **
P <
0.01 versus HFD‐WT.

