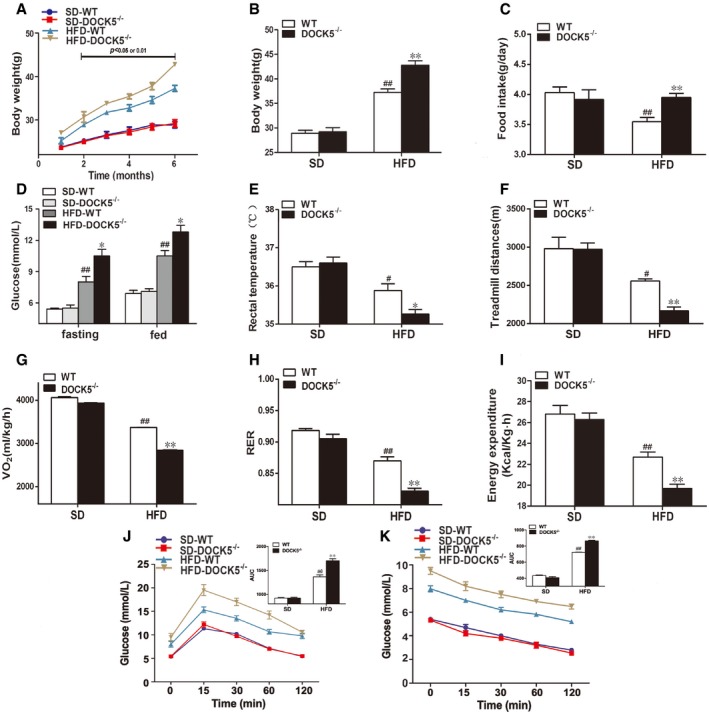
Eight‐week‐old male WT and DOCK5
−/− mice were fed a SD or a HFD for 6 months.
Body weight curve.
Cumulative body weight.
Average daily food intake.
Fasting and fed blood glucose.
Rectal temperature.
Locomotor tolerance.
VO2.
RER.
Energy expenditure.
GTTs.
ITTs.
Data information: SD, standard chow diet; HFD, high‐fat diet; V
O2, 24‐h oxygen consumption; RER, respiratory exchange ratio. Data are expressed as the mean ± SEM (
n = 5–6 for each group).
P‐values were determined with two‐way ANOVA.
#
P <
0.05,
##
P <
0.01 versus SD‐WT; *
P <
0.05, **
P <
0.01 versus HFD‐WT.

