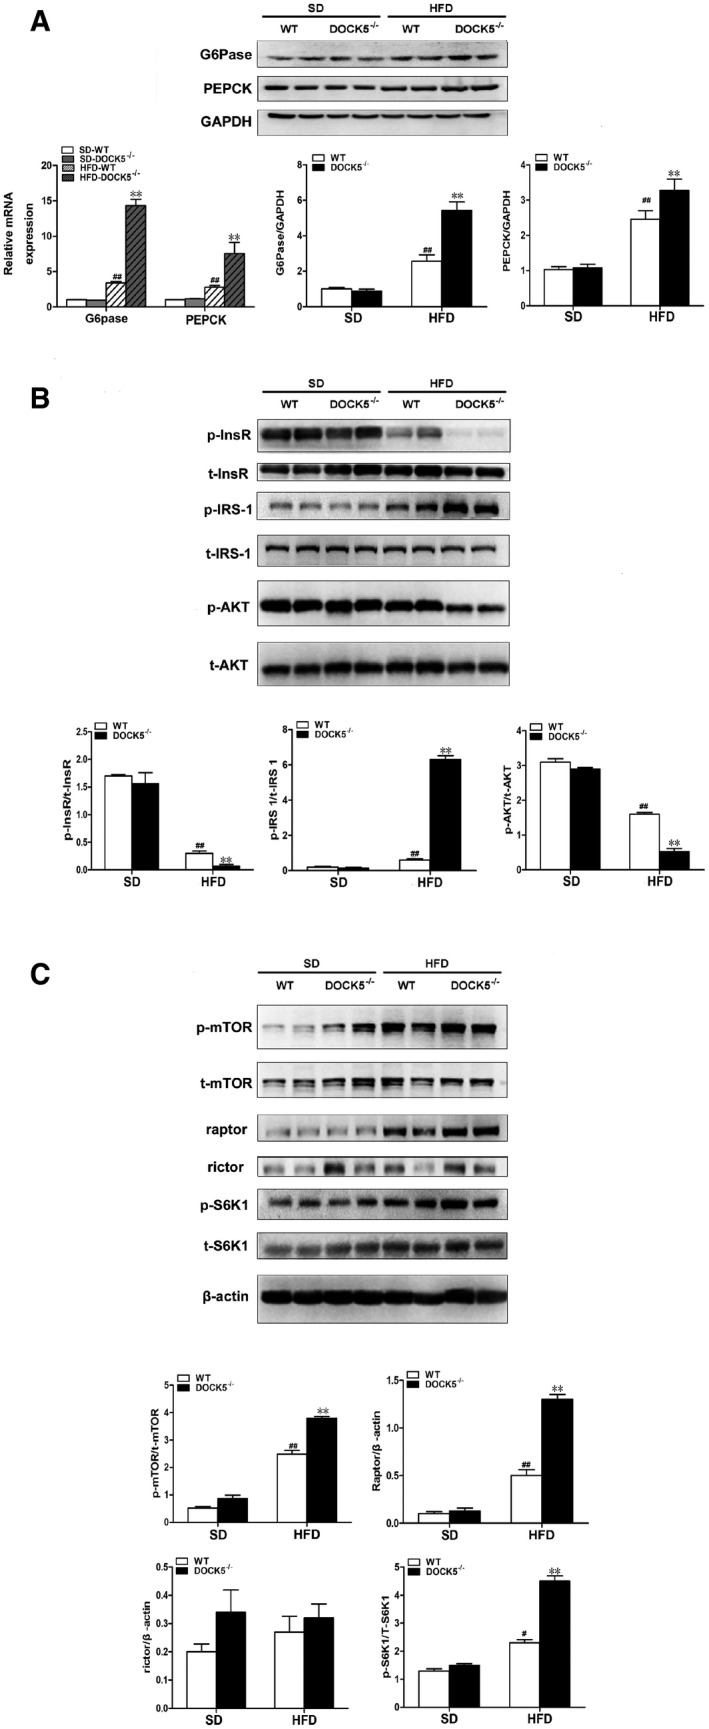
Eight‐week‐old male WT and DOCK5
−/− mice were fed a SD or a HFD for 3 months. Mice were treated with insulin (1 U/kg) or control (PBS) by intraperitoneal injection for 10 min; animals were killed, and livers were collected.
The expression of phosphoenolpyruvate carboxykinase(PEPCK) and glucose‐6‐phosphatase(G6Pase) mRNA and protein.
Total and phosphorylated insulin receptor (InsR), IRS‐1ser1101, and Akt.
Total and phosphorylated mTOR, S6K1, and the levels of Raptor and Rictor protein.
Data information: SD, standard chow diet; HFD, high‐fat diet. Data are means ± SEM (
n = 2 independent cell cultures).
P‐values were determined with
t‐test,
#
P <
0.05,
##
P <
0.01 versus SD‐WT; **
P <
0.01 versus HFD‐WT.
Source data are available online for this figure.

