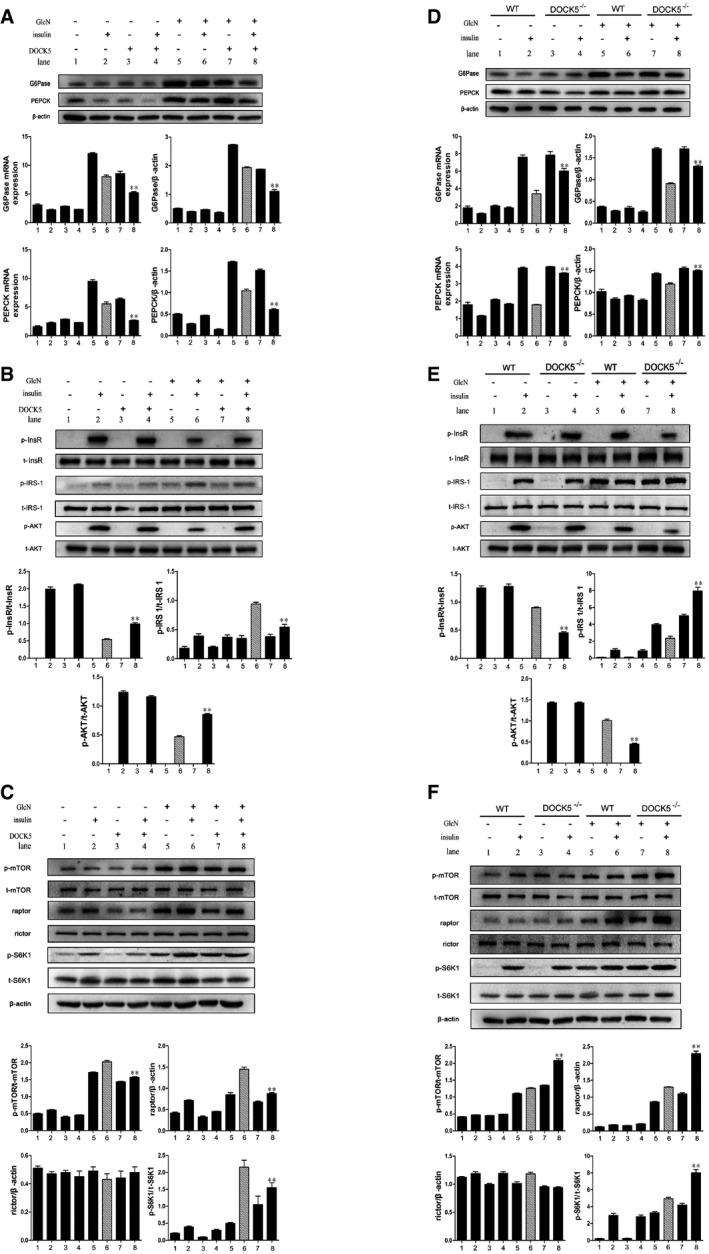
Hep1‐6 cells were infected with pCDNA3.1‐DOCK5 (DOCK5
+) or pCDNA3.1 (DOCK5‐) for 48 h. Hep1‐6 cells and MPHs isolated from WT and DOCK5
−/− mice were incubated in control (GlcN
−) or GlcN (GlcN
+) medium for the indicated times, followed with (Ins
+) or without (Ins
−) 100 nM insulin stimulation for 20 min.
The mRNA and protein expression of PEPCK and G6Pase in Hep1‐6 cells.
Total and phosphorylated InsR, IRS‐1Ser1101, and Akt in Hep1‐6 cells.
Total and phosphorylated mTOR and S6K1, and the levels of Raptor and Rictor protein in Hep1‐6 cells.
The mRNA and protein expression of PEPCK and G6Pase in MPHs.
Total and phosphorylated InsR, IRS‐1Ser1101, and Akt in MPHs.
Total and phosphorylated mTOR and S6K1, and the levels of Raptor and Rictor protein in MPHs.
Data information: GlcN, glucosamine. Data are means ± SEM of at least two independent experiments.
P‐values were determined with
t‐test, **
P <
0.01 versus lane 6.

