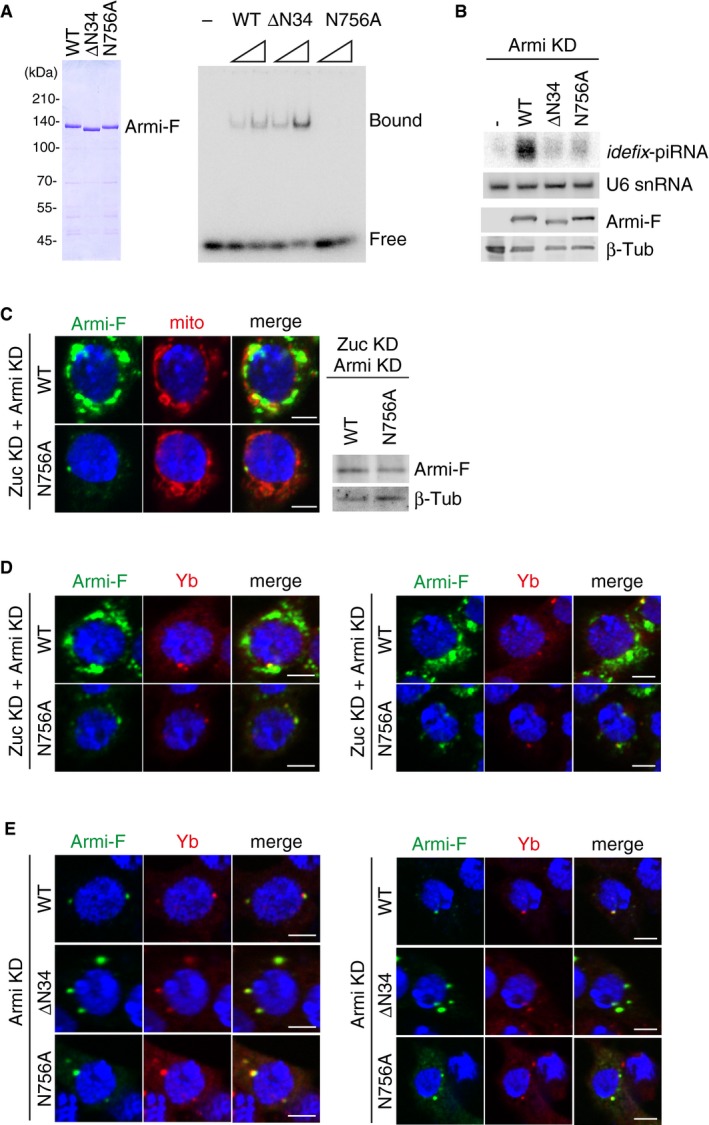
Figure EV5. The behaviors of Armi N756A mutant and ΔN34 mutant.

- Left: Purified recombinant Armi‐Flag (Armi‐F) WT and mutants (ΔN34 and N756A) used in the experiment. Right: RNA‐binding activity of Armi‐Flag WT, ΔN34, and N756A. Here, 16‐nt single‐stranded RNA was 5′‐end‐labeled and incubated with Armi‐Flag.
- Top: Northern blotting shows that siRNA‐resistant WT Armi‐Flag (Armi‐F), but not ΔN34 and N756A mutants, rescued the defects in idefix‐piRNA production caused by endogenous Armi depletion. U6 snRNA was used as a loading control. Bottom: The expression levels of Armi‐Flag (Armi‐F) WT, ΔN34, and N756A mutants. β‐Tubulin was used as a loading control.
- Left: Another set of cell images of the one shown in Fig 5B. The scale bar represents 5 μm. DAPI (blue) shows the nuclei. Right: The expression levels of Armi‐Flag (Armi‐F) WT and N756A mutant in Zuc/Armi‐depleted OSCs (Zuc KD + Armi KD). β‐Tubulin (β‐Tub) was detected as a loading control.
- Left: B. Armi‐Flag (Armi‐F) WT and the N756A mutant were expressed in OSCs where endogenous Armi and Zuc had been depleted by RNAi (Zuc KD + Armi KD). Armi‐F WT (green) localized onto mitochondria, whereas Armi‐F N756A mutant (green) localized to Yb bodies (red). The scale bar represents 5 μm. DAPI (blue) shows the nuclei. Right: Another set of cell images of the one shown on the left. The scale bar represents 5 μm. DAPI (blue) shows the nuclei.
- Left: Armi‐Flag (Armi‐F) WT and ΔN34/N756A mutants (green) localized at Yb bodies (red) in Armi‐depleted OSCs (Armi KD). Right: Another set of cell images of the one shown on the left. The scale bar represents 5 μm. DAPI (blue) shows the nuclei.
