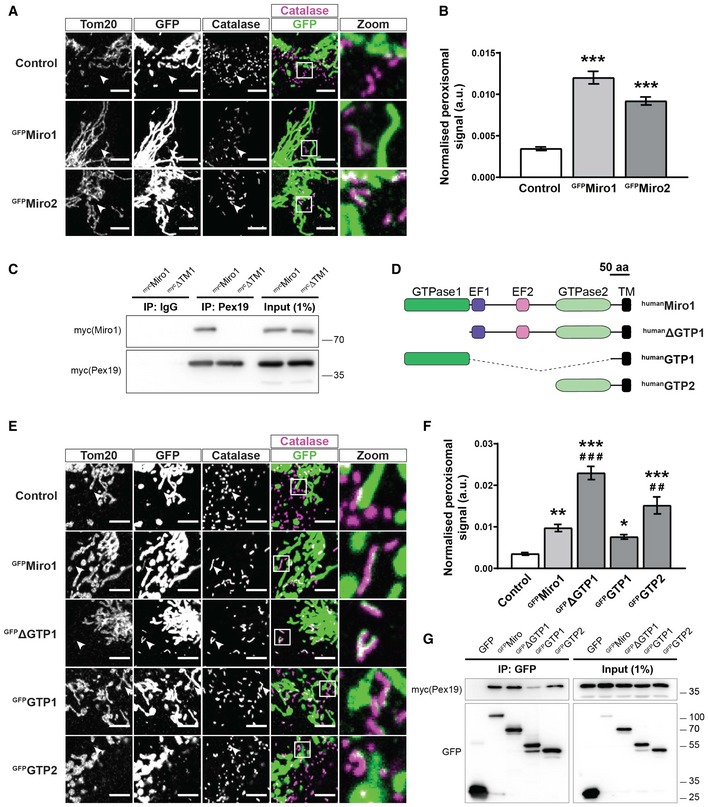
Representative zooms of WT MEFs transfected with GFP‐tagged Miro1 and Miro2 (GFPMiro1 and GFPMiro2). Control is GFP fused to the first 70 amino acids of Tom70. Tom20 and catalase stain mitochondria and peroxisomes, respectively. Merge is of Miro (green) and catalase (magenta) with co‐localisation shown as white. White arrowheads highlight an area where an isolated peroxisome is situated.
Quantification of the extent of GFP signal on peroxisomes.
Pulldown of overexpressed Pex19 in Cos7 cells with a Pex19 antibody shows interaction with full‐length Miro1 (mycMiro1), but not Miro1 lacking the transmembrane domain (mycΔTM1).
Schematic of Miro1 truncation mutants used in E‐G. TM denotes the transmembrane domain.
Representative images of Miro1 truncation constructs expressed in DKO MEFs. Mitochondria and peroxisomes are stained with Tom20 and catalase, respectively. White arrowheads highlight an area where an isolated peroxisome is situated.
Quantification of the extent of peroxisomal localisation of the Miro1 truncation constructs.
Co‐immunoprecipation of Miro1 truncation constructs and mycPex19 following transfection into Cos7 cells. GFP‐tagged Miro1 truncation constructs were pulled down with GFP‐Trap agarose beads, and Pex19 was probed with myc antibody.
Data information: (B and F) One‐way ANOVA with Newman–Keuls
post hoc test was used for all comparisons (
n = 18 cells per condition over three independent experiments). *, ** and *** denote
P < 0.05,
P < 0.01 and
P < 0.001 in comparison with control, respectively, and
## and
### denote
P < 0.01 and
P < 0.001 in comparison with
GFPMiro1, respectively. Data are represented as mean ± SEM. Scale bar is 5 μm.

