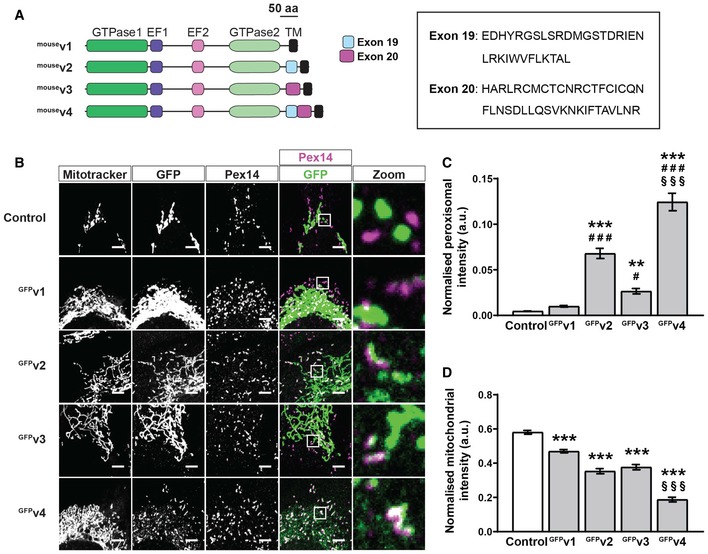
Schematic of mouse Miro1 splice variants including amino acid sequences of exon 19 and exon 20. TM denotes the transmembrane domain.
Representative images of DKO MEFs expressing control (GFP‐tagged 1‐70 of Tom70) or mouse Miro1 splice variants (GFPv1, GFPv2, GFPv3 and GFPv4 corresponding to variants 1, 2, 3 and 4, respectively). MitoTracker stains mitochondria, and Pex14 stains peroxisomes. Scale bar is 5 μm.
Comparison of Miro1 splice variant localisation to peroxisomes by thresholded GFP signal on Pex14‐positive and MitoTracker‐negative structures.
Comparison of splice variant localisation to mitochondria by thresholded GFP signal on MitoTracker‐positive and Pex14‐negative structures.
Data information: For (C) and (D),
n = 30 cells per condition over three independent experiments. ** denotes
P < 0.01 in comparison with control.
# is
P < 0.05 compared to
GFPv1. ***,
### and
§§§ denote
P < 0.001 in comparison with control,
GFPv1 and
GFPv2, respectively, by one‐way ANOVA with Newman–Keuls
post hoc test. Data are represented as mean ± SEM.

