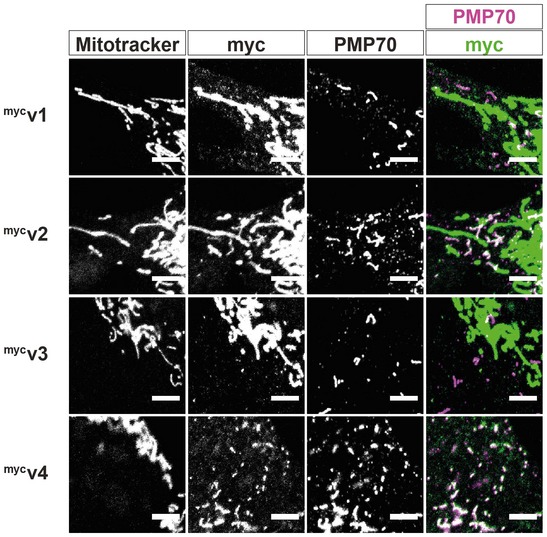
Figure EV2. Characterisation of myc‐tagged mouse Miro1 splice variants.

Representative images of myc‐tagged mouse Miro1 splice variants (mycv1, mycv2, mycv3 and mycv4 corresponding to variants 1, 2, 3 and 4, respectively). MitoTracker stains mitochondria, and PMP70 stains peroxisomes. Scale bar is 5 μm.
