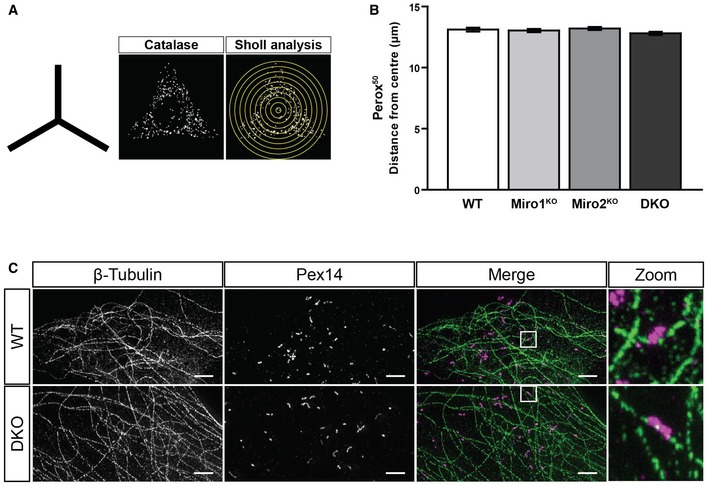
Figure EV3. Peroxisomes can still associate with microtubules following the loss of Miro.

- Schematic of the shape of the fibronectin patterns used for organelle distribution experiments and representative image of catalase signal of WT MEF on a micropattern along with a schematic of Sholl analysis.
- Quantification of the distance at which 50% of peroxisomal signal is situated in WT, Miro1KO, Miro2KO and DKO MEFs following Sholl analysis (n = 60 cells per condition over three independent experiments). No statistical significance was observed following a one‐way ANOVA. All data are represented as mean ± SEM.
- Representative images of STED imaging of β‐tubulin (microtubules in green) and Pex14 (peroxisomes in magenta) in WT and DKO MEFs. Scale bar is 2 μm.
