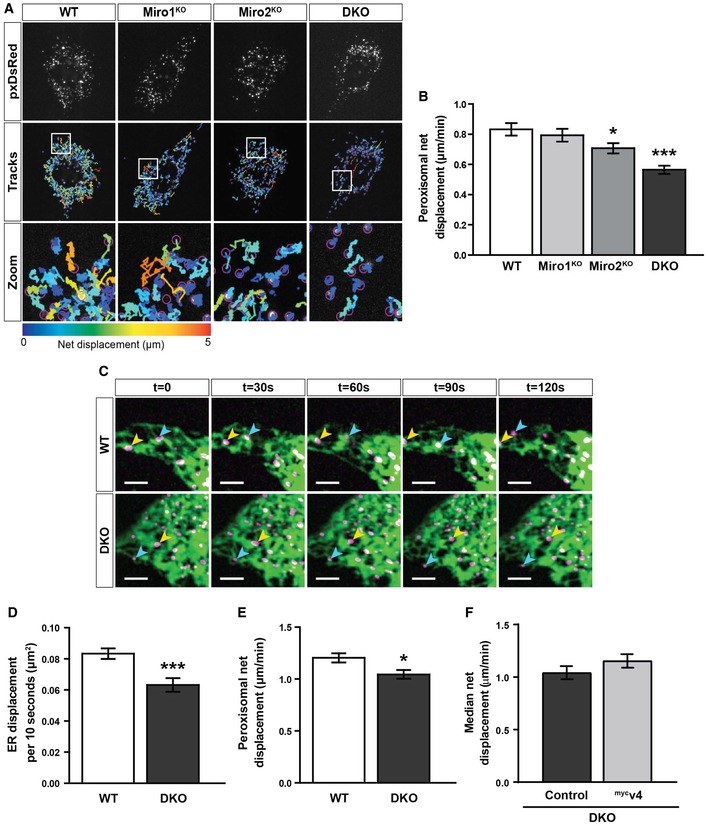
Snapshots and tracks of pxDsRed signal in WT, Miro1KO, Miro2KO and DKO MEFs following live imaging at 1.5 s per frame for 2 min.
Quantification of median net displacement of individual peroxisomes (pxDsRed signal) for WT, Miro1KO, Miro2KO and DKO MEFs (n = 42 cells over six independent experiments. Two different MEFs lines were used for each genotype).
Still images every 30 s of ER and peroxisomes (ER‐DsRed pseudo‐coloured to green and pxGFP pseudo‐coloured to magenta, respectively) in WT and DKO MEFs taken from 2‐min movies by live‐cell spinning‐disc microscopy. Arrows track individual peroxisomes associated with an ER tubule. Scale bar is 5 μm.
Quantification of the relative ER displacement over a 2‐min movie using ER‐DsRed signal in WT and DKO MEFs (n = 20 cells per condition over three independent experiments).
Median net displacement of peroxisomes in WT and DKO MEFs. n = 20 cells per condition over three independent experiments.
Median net displacement of peroxisomes in DKO MEFs with and without myc‐tagged variant 4 of Miro1 (mycv4) (n = 12 cells per condition over three independent experiments).
Data information: For multiple comparisons in (B), a one‐way ANOVA with Newman–Keuls
post hoc test was used to test for statistical significance. For (D–F), Student's
t‐test was used to calculate statistical significance. * and *** represent
P < 0.05 and
P < 0.001, respectively. Data are represented as mean ± SEM.

