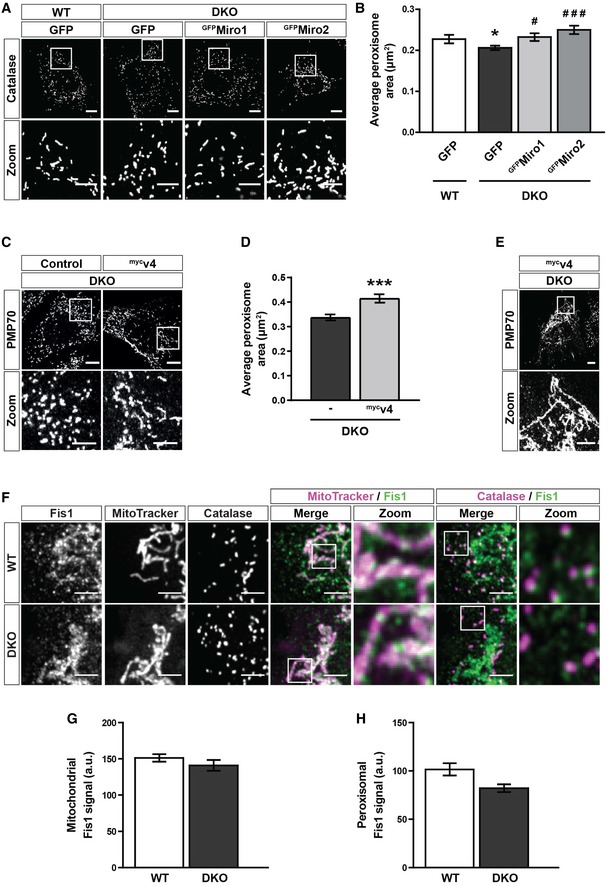
Representative images of catalase signal (peroxisomes) in WT MEFs and DKO MEFs either untransfected or expressing GFP‐tagged human Miro1 or Miro2 (GFPMiro1 and GFPMiro2, respectively).
Quantification of the average size of individual peroxisomes between WT, DKO, DKO‐expressing GFPMiro1 and DKO‐expressing GFPMiro2 (n = 36 cells per condition over three independent experiments).
Representative images and zooms of peroxisomes (PMP70) of DKO MEFs and DKO MEFs transfected with mycv4.
Quantification of the average size of individual peroxisomes in DKO MEFs compared to DKO MEFs transfected with mycv4 (n = 30 cells per condition over three independent experiments).
Representative image and zoom of the long‐reticulated peroxisomal morphology observed in 20% of mycv4‐expressing DKO cells.
Zooms of endogenous Fis1, mitochondria (MitoTracker) and peroxisomes (PMP70) in WT and DKO MEFs.
Integrated density of Fis1 signal on MitoTracker‐positive and PMP70‐negative structures in WT and DKO MEFs (n = 42 cells per condition over three independent experiments).
Integrated density of Fis1 signal on PMP70‐positive and MitoTracker‐negative structures in WT and DKO MEFs (n = 42 cells per condition over three independent experiments).
Data information: For (B) * denotes
P < 0.05 in comparison with WT.
# and
### denote
P < 0.05 and
P < 0.001, respectively, in comparison with DKO MEFs by one‐way ANOVA with Newman–Keuls
post hoc test. For (D), (G) and (H), statistical significance was tested with Student's
t‐test. *** is
P < 0.001. Scale bars are 10 μm, and 5 μm in zooms. Data are represented as mean ± SEM.

