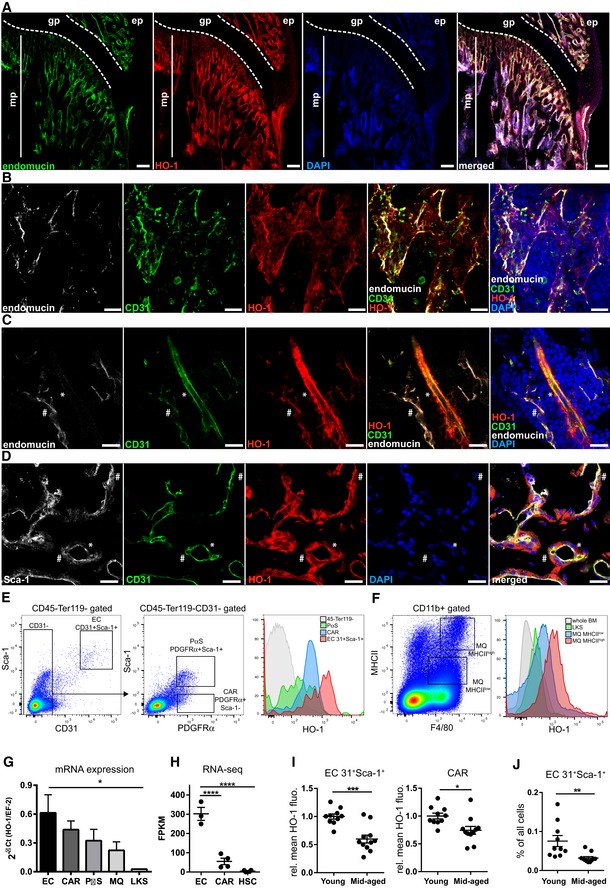
Figure 1. HO‐1 is expressed in BM endothelial cells and pericytes.

-
AMetaphysis region in the BM is rich in endomucin+ capillaries expressing HO‐1. mp—metaphysis; gp—growth plate; scale bar 100 μm.
-
BThe HO‐1‐positive small capillaries in metaphysis express endomucin and CD31. Shown maximum intensity projection, scale bar 20 μm.
-
CHO‐1 is expressed by smaller endomucin+CD31+ capillaries (#) as well as in bigger endomucin−/lowCD31+ arteries (*). CD31− pericytes wrapping the artery also express HO‐1 (*); scale bar 20 μm.
-
DHO‐1‐positive capillaries in the metaphysis expressed CD31 and Sca‐1. The capillaries are enveloped by HO‐1‐expressing pericytes. Part of the HO‐1+ pericytes express Sca‐1 (#), while others show no or low Sca‐1 signal (*); scale bar 20 μm.
-
EFlow cytometry analysis revealed the highest expression of HO‐1 in CD31+Sca‐1+ ECs. CAR and PαS populations also express HO‐1, while most of non‐hematopoietic CD45−Ter119− are HO‐1‐negative in steady‐state conditions.
-
FBM macrophages (MQs) express HO‐1. The MHCIIhigh MQ expresses higher levels of HO‐1 than MHCIIlow MQ. Cells within whole HSPC compartment (LKS) express no or low levels of HO‐1 in comparison with MQ.
-
G, HHO‐1 expression on mRNA level quantified by (G) qPCR or (H) RNA‐seq. qPCR analysis based on two independent experiments n = 10–11/group, and RNA‐seq analysis has n = 3–4/group, two‐tailed t‐test for two groups comparison, and one‐way ANOVA with Bonferroni post‐test for multiple group comparison. *P < 0.05, ****P < 0.0001. Data are shown as mean ± SEM.
-
IECs and CARs from middle‐aged animals (11–12 months) express lower levels of HO‐1 protein. Two independent experiments, n = 5–10/group. Data are shown as mean ± SEM. *P < 0.05, ***P < 0.001, two‐tailed unpaired t‐test.
-
JMiddle‐aged animals have lower frequency of ECs. Two independent experiments, n = 10–11/group. Data are shown as mean ± SEM. **P < 0.01, two‐tailed unpaired t‐test. The control staining of HO‐1 on HO‐1−/− bone marrow section is provided in Appendix Fig S1.
