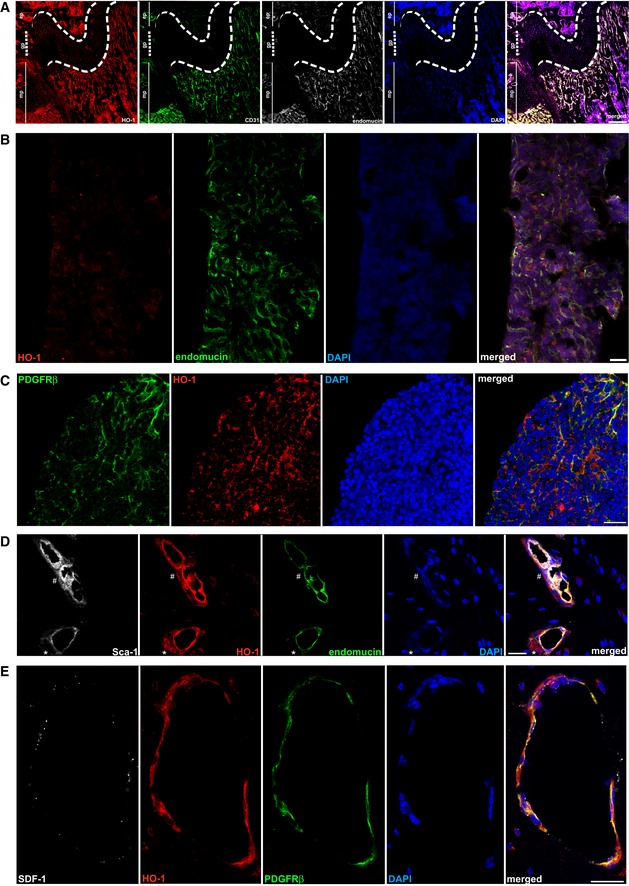
Figure EV1. Expression of HO‐1 in BM niche (related to Fig 1).

- HO‐1 is expressed by CD31+endomucin+ endothelial cells in metaphysis region of a tibia, scale bar 200 μm.
- HO‐1 is expressed in sinusoids in diaphysis region, however, at lower levels, scale bar 100 μm.
- PDGFRβ+ stromal cells in diaphysis region of the bone express HO‐1, scale bar 20 μm.
- Pericytes express HO‐1. Part of the HO‐1+ pericytes express Sca‐1 (#), while others express no or low levels of Sca‐1 (*), scale bar 20 μm.
- HO‐1 is expressed by PDGFRβ+ stromal cells. Part of HO‐1+PDGFRβ+ cells produce SDF‐1α, scale bar 20 μm.
