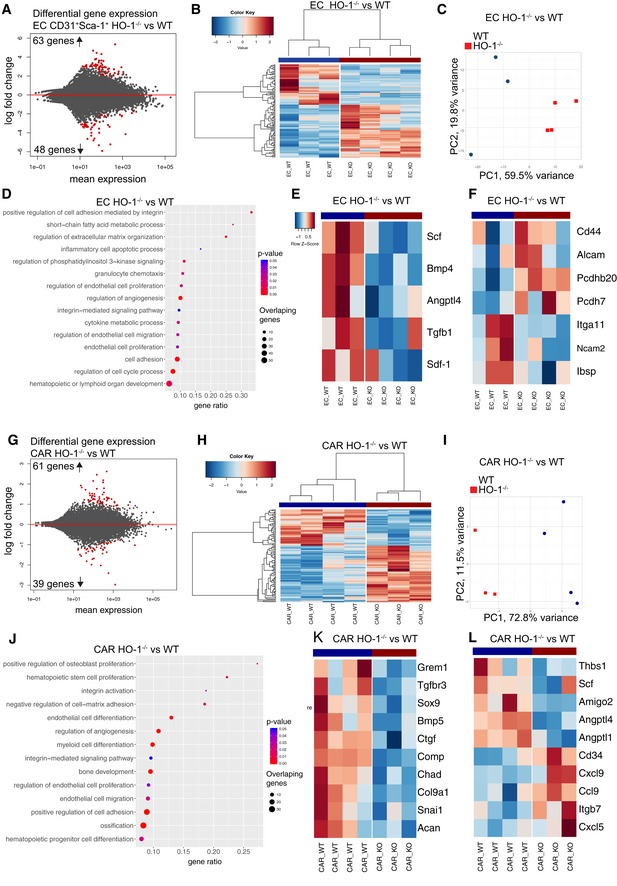
Figure 2. HO‐1 deficiency affects expression of hematopoietic factors in ECs and CARs.

-
ARNA‐seq revealed 111 DEGs in HO‐1−/− ECs.
-
B, CThe identified DEGs separated HO‐1−/− and HO‐1+/+ ECs by (B) hierarchical clustering and (C) PCA.
-
DSelected GOBP terms enriched in GSEA in HO‐1−/− ECs.
-
E, FHeatmap of selected (E) hematopoietic factors and (F) adhesion molecules expression in HO‐1−/− and HO‐1+/+ ECs.
-
GRNA‐seq revealed 100 DEGs in HO‐1−/− CARs.
-
H, IThe identified DEGs separated HO‐1−/− and HO‐1+/+ CARs by (H) hierarchical clustering and (I) PCA.
-
JSelected GOBP terms enriched in GSEA in HO‐1−/− CARs.
-
K, LHeatmap of selected (K) skeletal biology and (L) hematopoietic factors expression in HO‐1−/− and HO‐1+/+ CARs. Correlation similarity metric and average linkage clustering were used in the presented heatmaps.
