-
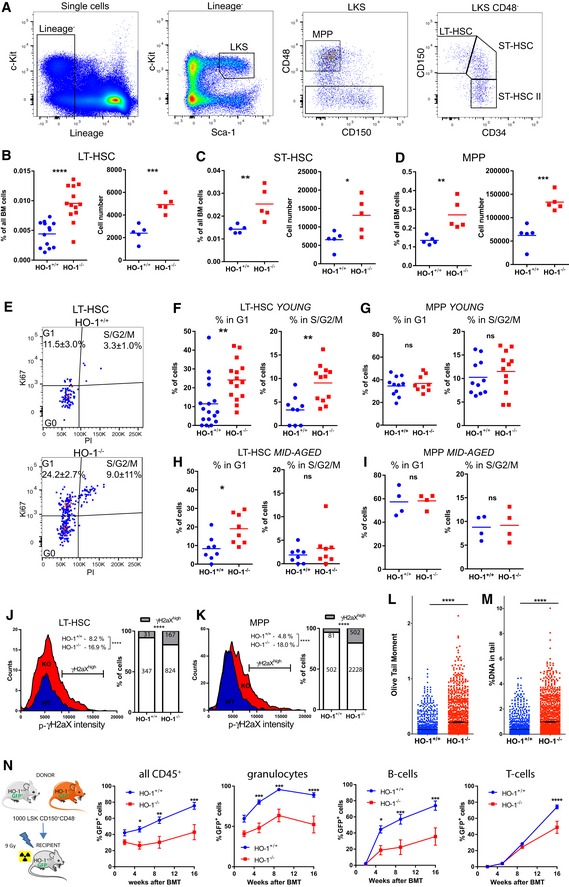
A
Gating strategy of hematopoietic stem and progenitor cells.
-
B–D
Young HO‐1−/− mice possess higher number of (B) LT‐HSCs, (C) ST‐HSCs, and (D) MPPs.
-
E
Exemplary analysis of cell cycle with Ki67 and nuclear dye.
-
F
More young HO‐1−/− LT‐HSCs are in G1 and S/G2/M cell cycle phases. The presented cell cycle analysis is from two independent experiments.
-
G
Young HO‐1−/− MPPs do not differ in cell cycling from young HO‐1+/+ MPPs. The presented cell cycle analysis is from two independent experiments.
-
H
More old HO‐1−/− LT‐HSCs are in G1 phase in comparison with old HO‐1+/+ LT‐HSCs, but not in S/G2/M phase. The presented cell cycle analysis is from two independent experiments.
-
I
Old MPPs do not differ in cell cycling between genotypes. The presented cell cycle analysis is from two independent experiments.
-
J
Young HO‐1−/− LT‐HSCs contain more γH2aXhigh cells than young HO‐1+/+; 378–991 cells analyzed from seven mice/group.
-
K
Young HO‐1−/− MPPs contain more γH2aXhigh cells than young HO‐1+/+; 1,693–2,790 cells analyzed from seven mice/group.
-
L, M
Alkaline comet assay revealed that HO‐1−/− LT‐HSCs possess (L) higher oil tail moment and (M) more DNA in the comet tail. 1,068–1,189 cells analyzed from six mice/group.
-
N
HSCs from young HO‐1−/− mice provide worse hematopoietic reconstitution after transplantation than HO‐1+/+ HSCs. Data are shown as mean ± SEM, n = 8–9 mice/group.
‐test was used. For contingency analysis (J and K), Fisher's exact test was applied. For two variable comparisons (N), 2‐way ANOVA with Bonferroni post‐test was used. *
< 0.0001.

