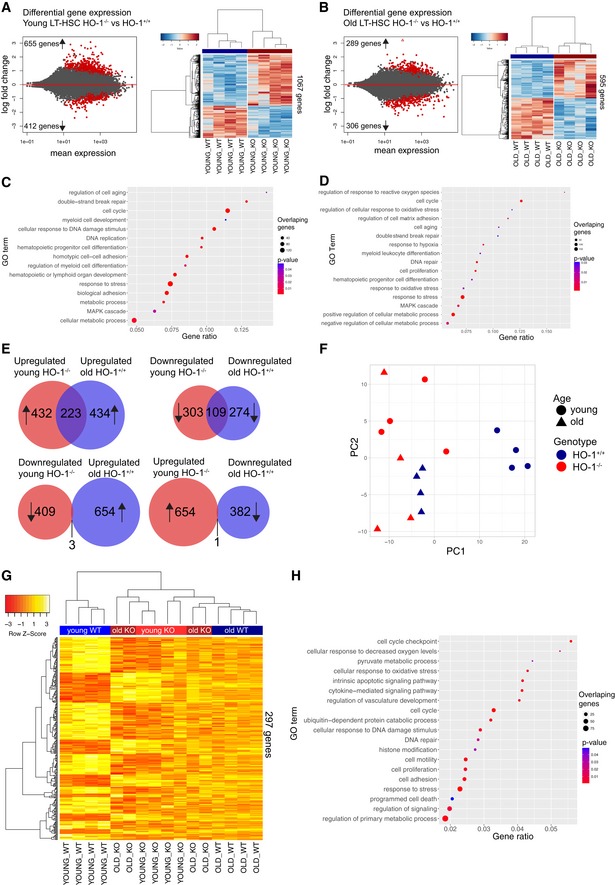
Figure 5. LT‐HSCs from young HO‐1−/− mice possess transcriptional profile resembling aged LT‐HSCs.

- RNA‐seq revealed 1,067 DEGs between young HO‐1−/− and HO‐1+/+ LT‐HSCs.
- RNA‐seq revealed 595 DEGs between old HO‐1−/− and HO‐1+/+ LT‐HSCs.
- Selected GOBP terms enriched in GSEA in young HO‐1−/− LT‐HSCs.
- Selected GOBP terms enriched in GSEA in old HO‐1−/− LT‐HSCs.
- Significant part of DEGs (31% total) in young HO‐1−/− LT‐HSCs overlaps with DEGs identified in LT‐HSCs during physiological aging.
- PC1 in PCA on selected 1,148 genes separated young HO‐1+/+ LT‐HSCs from other groups, clustering the young HO‐1−/− LT‐HSCs together with old LT‐HSCs.
- Hierarchical clustering on the 20% of most correlated 297 genes with PC1 showed two major clusters that include young HO‐1+/+ LT‐HSCs in one and old LT‐HSCs with young HO‐1−/− LT‐HSCs in second.
- Selected GOBP terms enriched in GSEA based on 297 identified genes.
