-
A
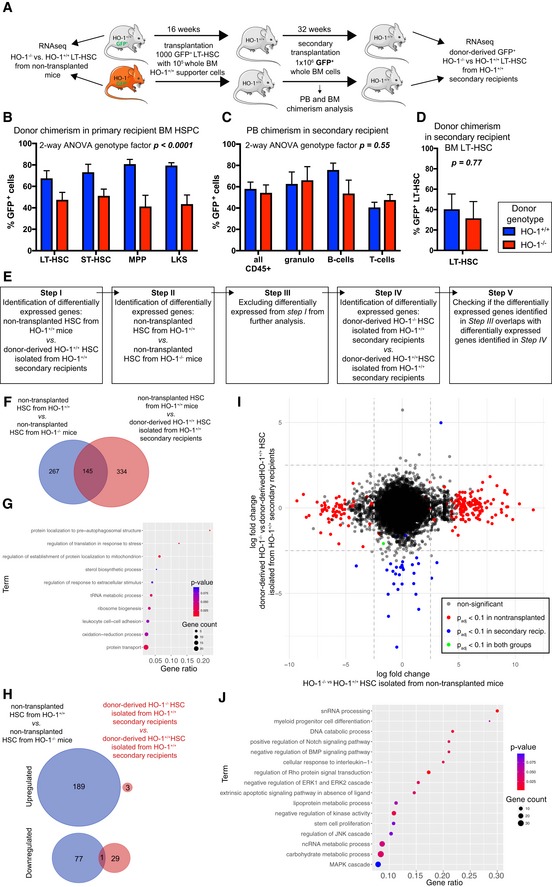
Scheme of the experiment verifying if the HO‐1+/+ niche is able to reverse phenotype of HO‐1−/− LT‐HSCs.
-
B
Transplantation of HO‐1−/− HSCs provides lower chimerism among HSPC fractions in primary recipients. Data are shown as mean ± SEM, n = 7–8 mice/group.
-
C, D
Transplantation of the same number of donor‐derived BM cells from primary recipients provides the same (C) PB chimerism and (D) BM LT‐HSC chimerism. Data are shown as mean ± SEM, n = 7–8 mice/group.
-
E
Analysis pipeline used to determine whether transplantation of HO‐1−/− HSCs to the HO‐1+/+ recipients reverses their transcriptional alterations.
-
F
Overlap between DEGs in young HO‐1−/− HSCs and DEGs changed by transplantation alone. A total of 145 overlapping genes were excluded from further analysis.
-
G
GSEA based on 145 excluded genes indicates processes that cannot be analyzed with the pipeline.
-
H
Only 1 out of 267 DEGs identified in non‐transplanted HO‐1−/− LT‐HSCs was still dysregulated in HO‐1−/− LT‐HSCs transplanted twice to the wild‐type HO‐1+/+.
-
I
Comparison of gene log‐fold changes in non‐transplanted HO‐1−/− LT‐HSCs and HO‐1−/− LT‐HSCs transplanted twice to the wild‐type HO‐1+/+ showed that transplantation of HO‐1−/− LT‐HSCs twice to the wild‐type niche reverses their transcriptional alterations.
-
J
GSEA based on genes that were altered in non‐transplanted HO‐1−/− LT‐HSCs, but were normalized by double transplantation to the wild‐type niche.

