-
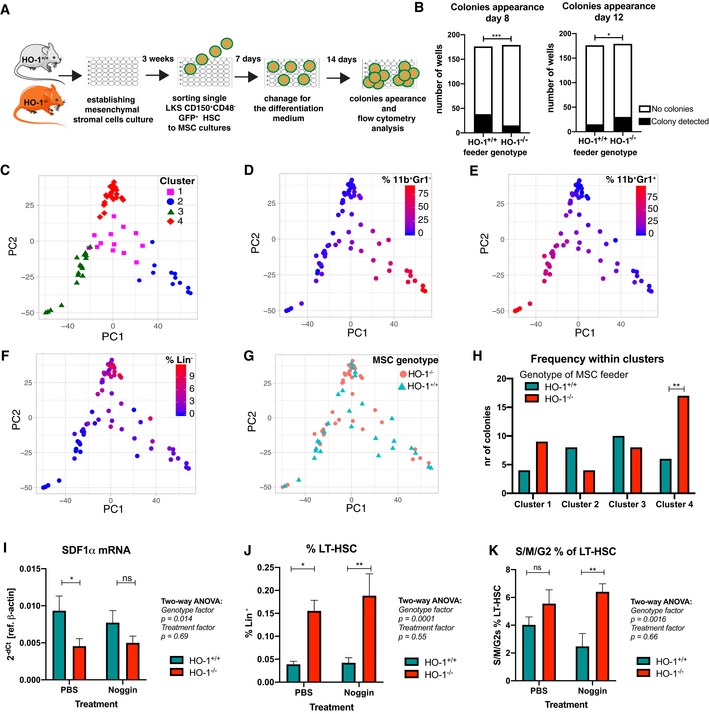
A
Scheme of experiment based on HSC co‐culture with MSCs and colony formation from single cells in differentiation media.
-
B
Frequency of colonies appearing at day 8 and day 12 from HSCs co‐cultured with HO‐1+/+ or HO‐1−/− MSCs. *P < 0.05, ***P < 0.001, Fisher's exact test.
-
C–F
PCA and cluster analysis of the colonies based on initial flow cytometry gating revealed (C) four distinct clusters of colonies that differ by frequency of (D) CD11b+Gr1−, (E) CD11b+Gr1+, and (F) cells lacking expression of analyzed lineage markers (Lin−).
-
G, H
Analysis of frequency of colonies derived from HO‐1+/+ or from HO‐1−/− MSC co‐cultures among identified clusters. Enrichment in cluster analyzed by Fisher's exact test, **P < 0.01, two‐tailed unpaired t‐test.
-
I
Sdf1α mRNA levels in BM of HO‐1+/+ or HO‐1−/− mice after administration of Noggin. Data are shown as mean ± SEM. *P < 0.05, two‐tailed unpaired t‐test, n = 10/group.
-
J, K
(J) LT‐HSC frequency and (K) cell cycling status of LT‐HSCs after administration of Noggin to HO‐1+/+ or HO‐1−/− mice. Data are shown as mean ± SEM. *P < 0.05, **P < 0.01, two‐tailed unpaired t‐test, n = 8–10/group.

