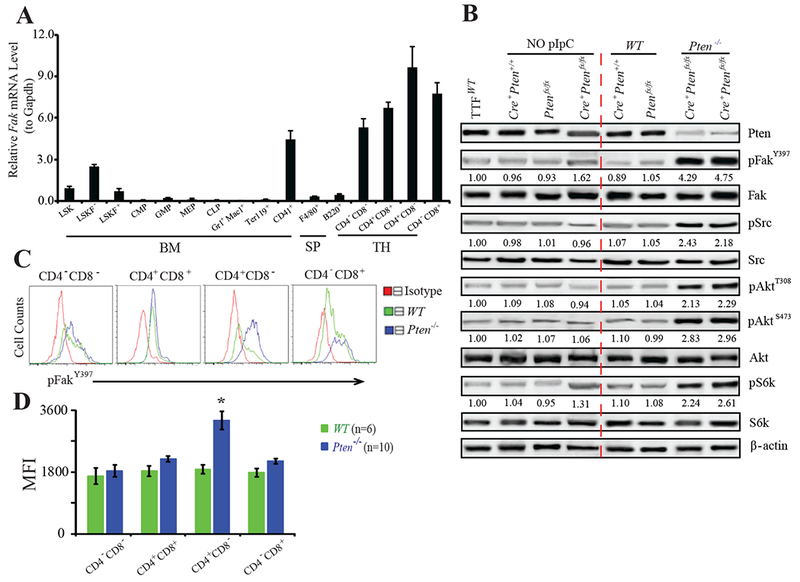
Figure 1. Akt and Fak Signals are Highly Activated in Pten−/− Thymocytes.

(A) Fak expression in Lin−Sca1+c-Kit+ (LSK), LSKFlk2−, LSKFlk2+, CMP, GMP, MEP, CLP, Gr1+Mac1+, Ter119+, and CD41+ cells isolated from BM; F4/80+, B220+ cells from SP; and CD4−CD8−, CD4+CD8+, CD4+CD8−, CD4−CD8+ cells from TH of WT mice. (B) Fak and Akt activities in WT and Pten−/− thymocytes. Controls: thymocytes from mice without pI:C injection; WT tail tip fibroblasts (TTF). Images representative of three independent experiments. Quantification (Multi Gauge 3.0) relative to WT control after normalized to loading controls. (C&D) pFakY397 in T-lymphocytes measured by FACS (C), and quantified by mean fluorescence intensity (MFI) (D). Data shown are Mean ± S.E.M. * compared to WT, P< 0.001, by Student’s t-test.
