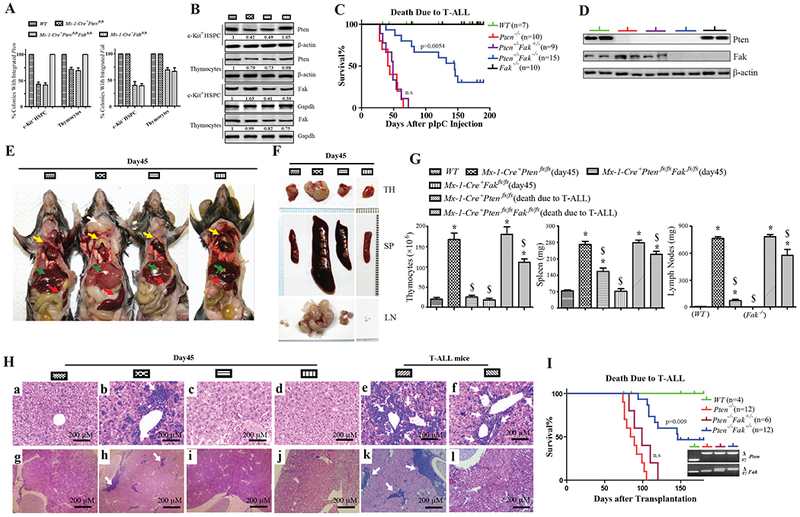
Figure 2. Fak Deletion Significantly Delays the Development of T-ALL in Pten−/− Mice.

(A&B) Pten and Fak induced deletion efficiency (A), and Pten and Fak protein (B) in c-Kit+ HSPCs and thymocytes on day 10 treated with single pI:C. (C) Kaplan-Meier survival curve of indicated mice with a single pI:C injection; compared to Pten−/−, P=0.0054. (D) Pten and Fak protein in thymocytes recovered from moribund T-ALL mice. (E&F) Phenotypes on day 45 after single pI:C injection. Anatomic mice images: white arrow, lymph nodes; yellow arrows, thymuses; green arrows, livers; and red arrows, spleens (E). TH, SP, and LN (F). Images shown are representative of five independent experiments. (G&H) Phenotypes on day 45 and moribund T-ALL mice after single pI:C injection. Thymocyte number, SP and LN weight: data shown are Mean ± S.D. * compared to WT, $ compared to Pten−/−, P<0.001, by 2-way ANOVA tests (G). Images of H&E staining for lymphocytes infiltrated into livers and kidneys (H). (I) Kaplan-Meier survival curve of recipient mice (CD45.2+) transplanted with CD3+c-Kitlow cells from BM of indicated mice (CD45.1+) on day 10 after 5×pI:C injections. Compared to Pten−/−-recipient mice, P= 0.009. Inset: donor cell genotype immediately prior to transplantation.
