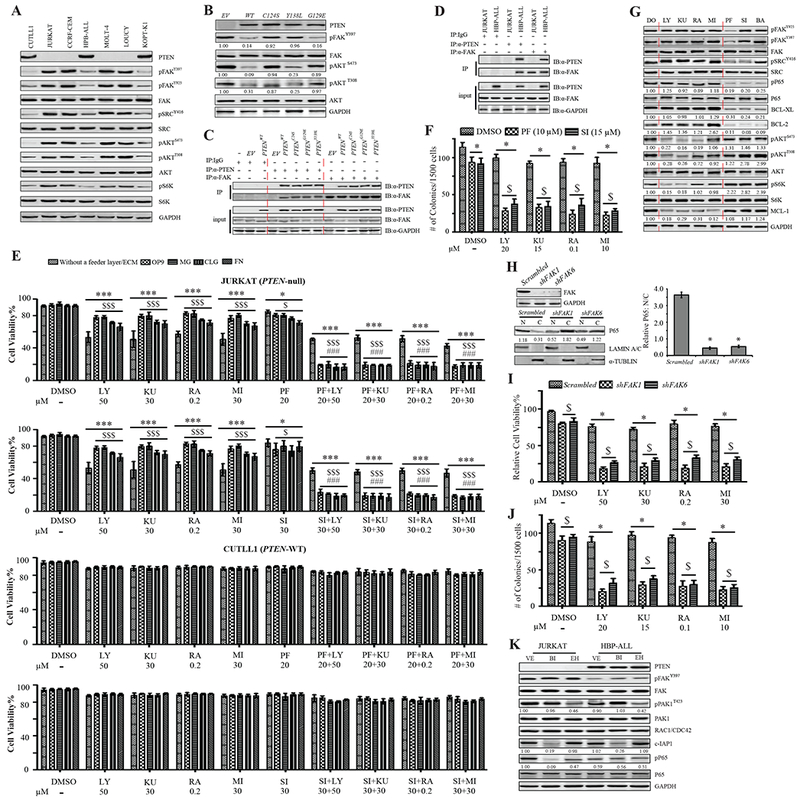
Figure 6. PI3K/AKT/mTOR/MCL-1 and FAK/NF-κB/BCL-xL/BCL-2 Represent Two Parallel Survival Signaling Pathways in PTEN-mutant Human T-ALL Cell Lines.

(A) PTEN, pFAK, pSRC, pAKT and pS6K expression in human T-ALL cell lines, CUTLL1, JURKAT, CCRF-CEM, HPB-ALL, MOLT-4, LOUCY, and KOPT-K1, cultured on MG-coated plates. (B) PTEN, pFAK and pAKT in PTENWT, or PTENC124S, PTENG129E, or PTENY138L-transduced JURKAT cells cultured on MG-coated plates; control: empty vector (EV) transduced cells. (C&D) The binding of PTEN and FAK in transduced JURKAT cells (C) and HBP-ALL cells (D). (E) Viability of human T-ALL cell lines in suspension, on OP9, or on MG/CLG/FN-coated plates, treated by DMSO (DO), LY, KU, RA, MI, PF, or LY+PF, KU+PF, RA+PF, MI+PF. Data shown are Mean ± S.D. ***, * compared to DO treatment, and $$$, $ compared to suspension culture, P<0.001, <0.05, respectively; ### compared to single inhibitor treatment, P<0.001. (F) Colony number of JURKAT cells treated with DO, LY, KU, RA, or MI, alone or in combination with PF or SI. Data shown are Mean ± S.D. * compared DO treatment, $ compared to single inhibitor treatment, P<0.001. (G) pFAK, pSRC, pP65, pAKT, pS6K, BCL-xL, BCL-2 and MCL-1 expression in JURKAT cells cultured on MG-coated plates treated by DO, LY, KU, RA, MI, PF, SI, or BA, respectively. (H) Nuclear (N) and cytoplasmic (C) P65 in JURKAT cells with knockdown of FAK by shRNA. Data shown are Mean ± S.D. * compared to scrambled, P<0.001. (I&J) Viability, cultured on MG-coated plates (I) and colony forming ability (J) of JURKAT cells to FAK inhibition by shRNA, treated with DO, LY, KU, RA, or MI. Data shown are Mean ± S.D. * compared to DO treatment, $ compared to scrambled, P<0.001. (K) The levels of pFAK, pPAK1, pP65, and the expression of PTEN, RAC1/CDC42, c-IAP1 in JURKAT and HBP-ALL cells. Images shown in western blot are representative of three to five independent experiments. All statistical values were determined by 2-way ANOVA.
