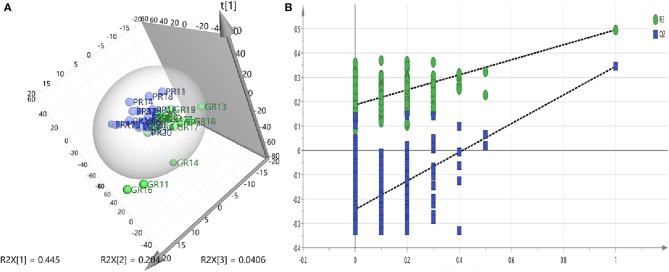
Figure 2.
(A) PLS-DA models—Two-component plots of GR and PR (green = GR, blue = PR) from UHPLC-MS metabolic profiles, demonstrate clear separation between the GR and PR groups. (B) Validation plots for the PLS-DA model obtained from 200 permutation tests (green = R2, blue = Q2): the intercepts of Q2 were <0.

