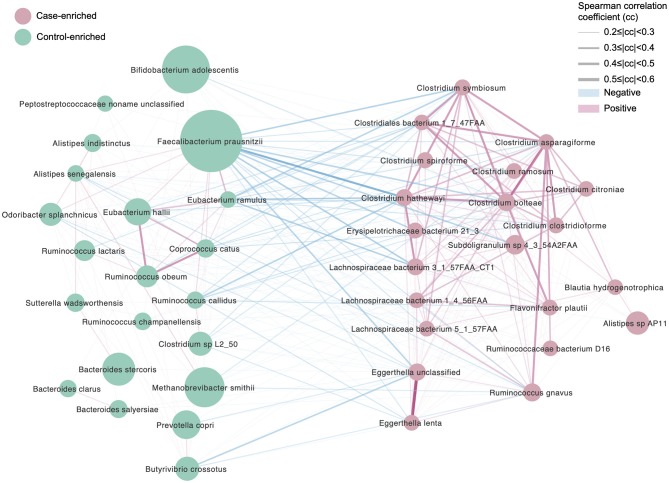
Figure 2.
Differentially enriched species, control vs. migraine. The orientation of enrichment was determined by two-tailed Wilcoxon-rank sum test (U statistic of two-tail Wilcoxon rank-sum test, p < 0.05, FDR< 0.29, Table S4C). The size of the nodes is consistent with the relative abundance of the species. Species were colored according to the extent of enrichment. The edges between the nodes indicate positive (red) and negative (blue) Spearman's correlation, respectively, the line width represents the correlation coefficient calculated for the samples under comparison.

