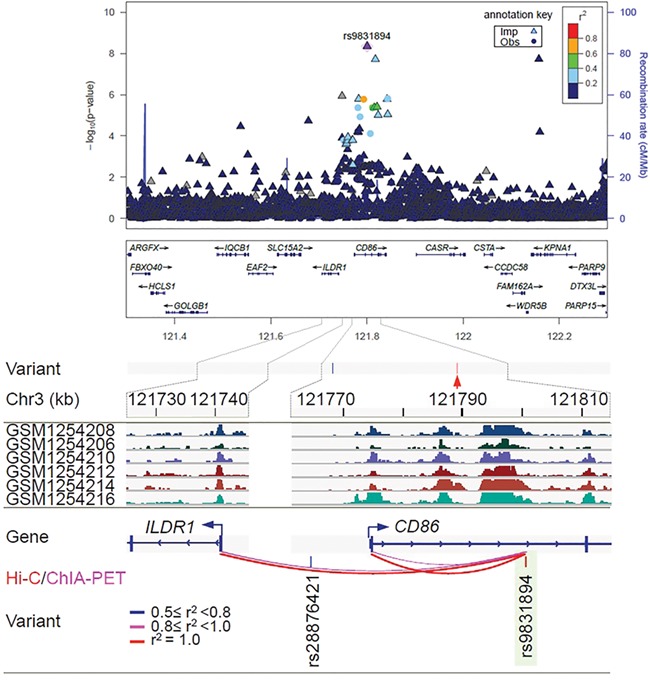
Figure 1.

Regional association plot and epigenetic features of rs9831894 at independent loci associated with the risk of diffuse large B-cell lymphoma (DLBCL). At the top of the figure is the regional association plot of rs9831894; −log10 association P-values from the discovery log-additive genetic model for all SNPs in the region (dots and triangles). The lead SNPs are shown in purple. Recombination rates estimated from 1000 Genomes are plotted in blue. The SNPs surrounding the most significant SNP are color coded to reflect their correlation with that SNP. Pairwise r2 values are from 1000 Genomes European data. Locations of recombination hotspots are depicted by peaks corresponding to the rate of recombination (blue vertical lines). The rest of figure shows the epigenetic features: Epigenetic features at the 3q13.33 risk locus. Tag SNP rs9831894 (red arrow) has only one linked variant (r2 ≥ 0.5). The GWAS SNP rs9831894 is in a super-enhancer in DLBCL patient biopsies. The region spanning rs9831894 (highlighted in green) showed looping interactions with the promoters of CD86 and ILDR1.
