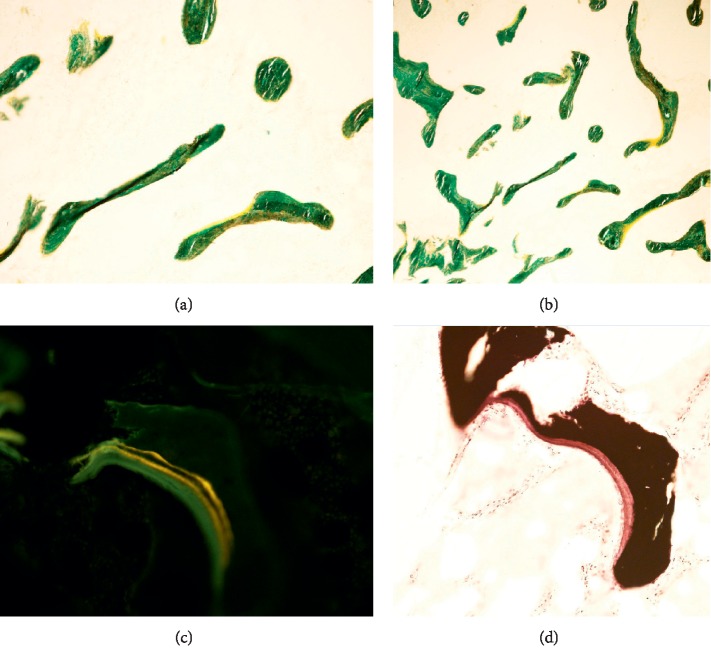
Figure 2.
Bone biopsy. (a) High resolution (alkaline phosphatase staining). (b) Low resolution (alkaline phosphatase staining). Both low and high power showed irregularity, variability, and loss of connectivity of bone trabeculae, with some thinning and scattered bone nubbins. (c) Unstained bone biopsy. (d) The Von Kossa (calcium) stain showed the thickened osteoid seam (red) with the calcified bone (black).

