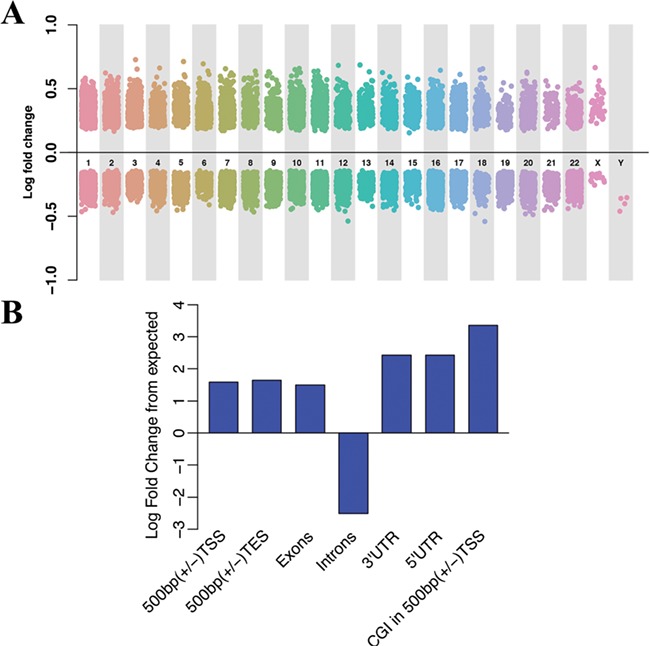
Figure 1.

Genome-wide hydroxymethylation profiling in AD brain tissues. (A) Genome-wide hydroxymethylation profiling in AD brain tissues. The horizontal axis represents the human chromosomes, and the vertical axis indicates the levels of 5hmC enrichment. (B) Genomic distribution of DhMRs. Histogram of the log fold change from expected versus genomic locations. The height of the bar indicates the percentage of DhMRs located in the corresponding regions. TSS, transcription start site; TES, transcription end site; UTR, untranslated region; CGI, CpG island.
