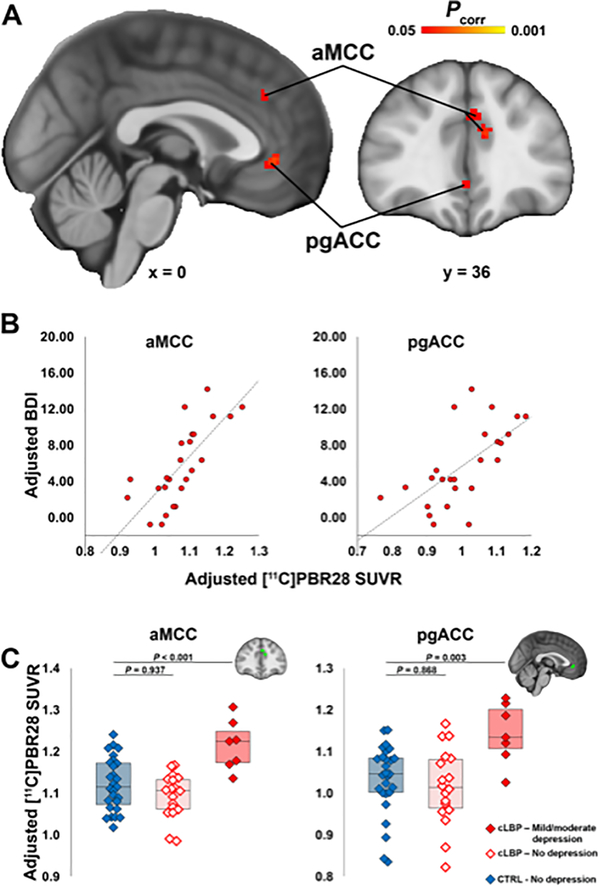
Figure 2. Voxelwise [11C]PBR28 signal is associated with depressive symptoms and elevated in patients with mild-to-moderate depression.
A. Results from the voxelwise analysis showing clusters where [11C]PBR28 SUVR is significantly positively associated with BDI. B. For visualization purposes, average SUVR from the aMCC and pgACC clusters in panel A are plotted against BDI, both adjusted for TSPO polymorphism. C. Results from the ANCOVA analysis comparing average aMCC and pgACC SUVR between cLBP patients with little-to-no depression, mild-to-moderate depression, and controls. P-values represent results from post-hoc Dunnett’s tests comparing both patient subgroups against to controls. All values have been adjusted for age, injected dose, and TSPO polymorphism.

