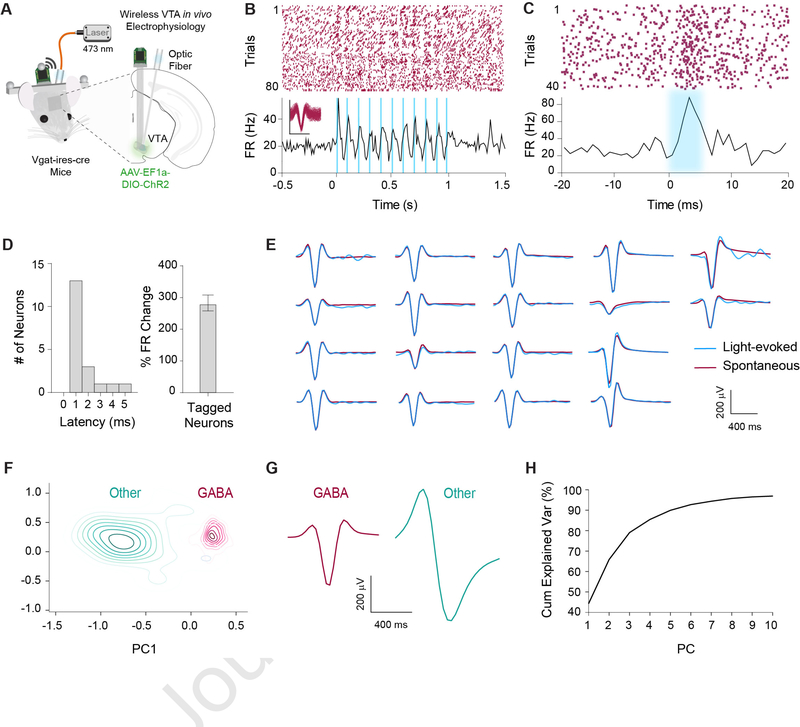
Figure 1. Optogenetic identification of VTAVgat+ neurons.
(A) Schematic illustration of optrode in the VTA for simultaneous optogenetic excitation and recording of VGAT+ neurons in Vgat-ires-Cre mice (n = 6).
(B) Representative example of an optically tagged VTAVgat+ neuron using 10 Hz stimulation.
(C) Another representative neuron showing very short latency in response to light stimulation.
(D) Left: All tagged GABAergic neurons had a latency of < 6 ms (n = 18). Right: Optically tagged GABAergic neurons displayed a significant increase in firing rate in response to light stimulation compared to baseline (p < .0001).
(E) Fidelity analysis demonstrating similarity of waveforms between spontaneous (maroon) and light-evoked (blue) waveforms.
(F) Contour plot of the first two principal components out of 10 within an unsupervised clustering of neuronal waveforms. Post hoc analysis revealed all optically tagged VTAVgat+ neurons fell within one cluster. The remaining neurons that fell within the same cluster were classified as putative GABAergic neurons.
(G) Average waveforms for cells classified as GABAergic (n = 421) or other (n = 58).
(H) Cumulative explained variance for each principal component. Ten principal components accounted for over 95% of the variance within the neuronal waveforms. See also Figure S7.

