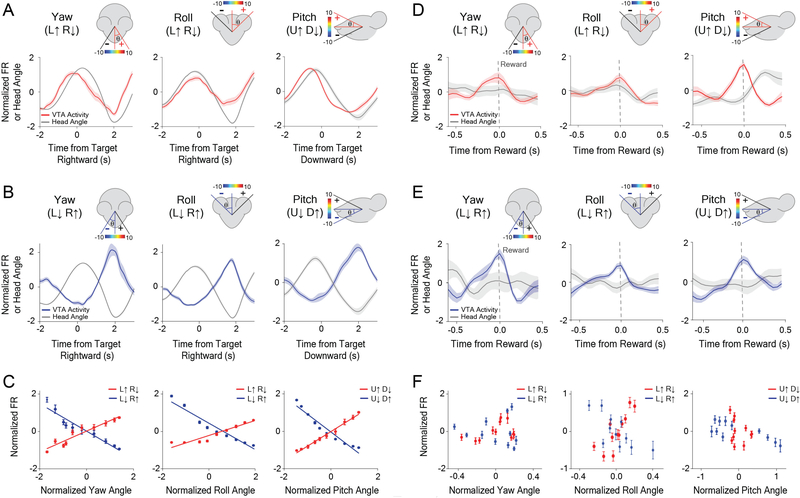
Figure 3. VTA GABAergic ensembles represent yaw, roll, and pitch, but these representations degrade at the time of reward.
(A-C) Population activity precisely represents orthogonal angles of head rotation.
(A) Neuronal population for Yaw (L↑ R↓, increase firing with leftward tilt and decrease firing with rightward tilt) neurons (left, n = 16), Roll (L↑ R↓) neurons (middle, n = 28), and Pitch (U↑ D↓) neurons (right, n = 16) during reward tracking. Traces and error bars represent the Mean ± SEM.
(B) Opponent neuronal populations for Yaw (L↓ R↑) neurons (left, n = 10), Roll (L↓ R↑) neurons (middle, n = 34), and Pitch (U↓ D↑) neurons (right, n = 13) during reward tracking.
(C) Population average showing correlation between head angle and VTA neuronal firing rate while tracking reward: Yaw angle (left) (Yaw (L↑ R↓): PC, r2 = 0.91, p < .0001, n = 16; Yaw (L↓ R↑): PC, r2 = 0.92, p < 0.0001, n = 10). Roll Angle (middle) (Roll (L↑ R↓): PC, r2 = 0.92, p < 0.0001, n = 28; Roll (L↓ R↑): PC, r2 = 0.94, p < 0.0001, n = 34). Pitch Angle (right) (Pitch (U↑ D↓): PC, r2 = 0.99, p < 0.0001, n = 16; Pitch (U↓ D↑): PC, r2 = 0.94, p < 0.0001, n = 13).
(D-F) Degradation of neural coding for head angle at the time of reward consumption.
(D) Neural population for Yaw (L↑ R↓) neurons (left, n = 16), Roll (L↑ R↓) neurons (middle, n = 28), and Pitch (U↑ D↓) neurons (right, n = 16) at the time of reward.
(E) Neural population for Yaw (L↓ R↑) neurons (left, n = 10), Roll (L↓ R↑) neurons (middle, n = 34), and Pitch (U↓ D↑) neurons (right, n = 13) at the time of reward.
(F) Population average showing correlation between head angle and firing rate during reward consumption: Yaw angle (left) (Yaw (L↑ R↓): PC, r2 = 0.18, p > 0.05 n = 16; Yaw (L↓ R↑): PC, r2 = 0.005, p > 0.05, n = 10). Roll Angle (middle) (Roll (L↑ R↓): PC, r2 = 0.65, p = 0.003, n = 28; Roll (L↓ R↑): PC, r2 = 0.53, p = 0.01, n = 34). Pitch Angle (right) (Pitch (U↑ D↓): PC, r2 = 0.09, p > 0.05, n = 16; Pitch (U↓ D↑): PC, r2 = 0.56, p = 0.01, n = 13). Traces and error bars represent the Mean ± SEM.

