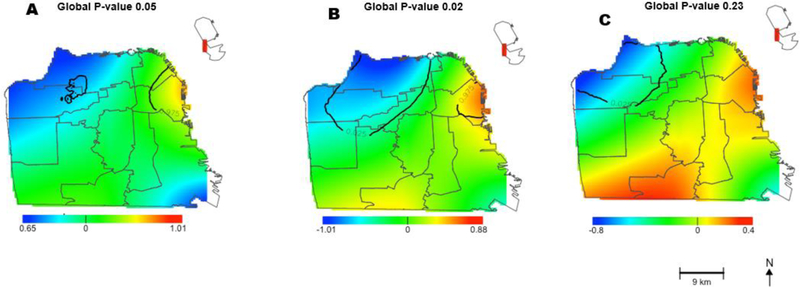
Figure 4:
Spatial variation in the reduction of tobacco retailers in San Francisco after the density ordinance. The map shows the significant hotspots based on 999 permutations A) Crude map without adjusting for any covariates B) Adjusted map based on race and income C) Adjusted map based on race, income, and land.

