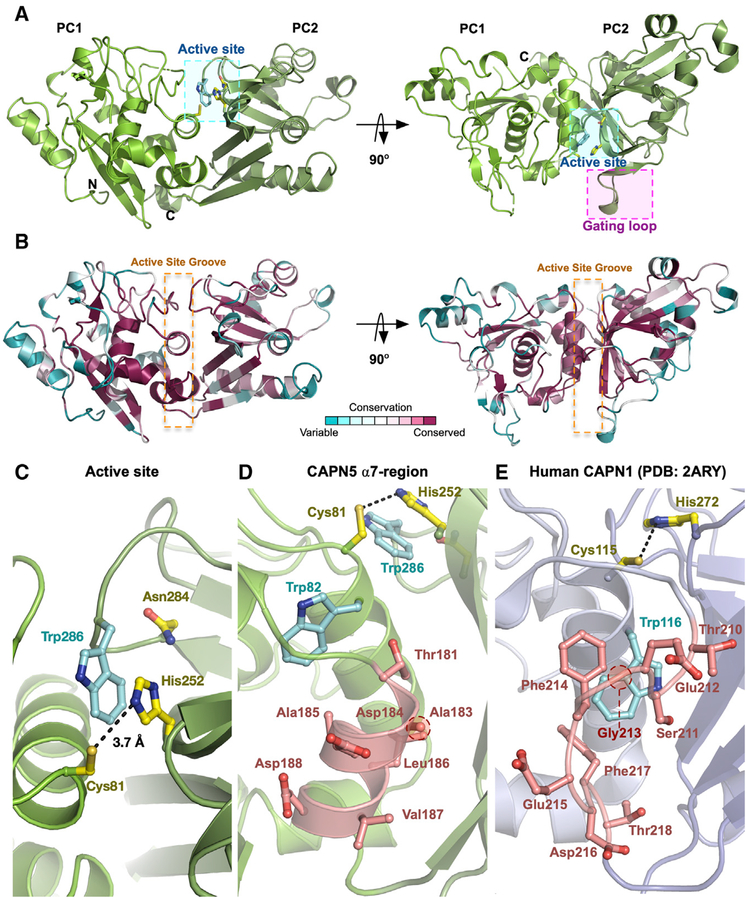
Figure 2. Crystal Structure of CAPN5-PC.
(A) Ribbon tracing diagram representing domains PC1 and PC2 of CAPN5-PC. Catalytic residues and Trp286 are denoted by the cyan box. The G1 gating loop is denoted by the magenta box.
(B) Ribbon tracing diagram representing CAPN5-PC colored by the ConSurf evolutionary conservation scale. The orange dotted box denotes the active site groove.
(C) Active-site cleft of CAPN5-PC. Black dashes indicate the distance between the catalytic histidine and cysteine.
(D) Formed α7-region of CAPN5-PC.(E) Disordered α7-region of human CAPN1-PC (PDB: 2ARY).

