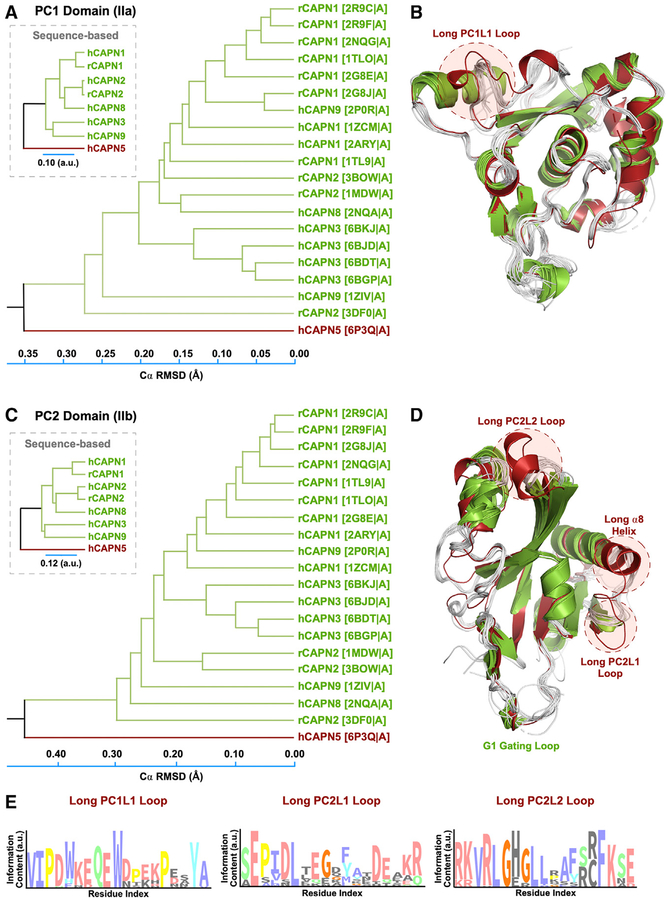
Figure 4. Structural Phylogenetic Analysis Reveals Unique Features in CAPN5-PC.
(A) Structure-based phylogenetic tree of PC1 domains. The evolutionary distance was inferred using the UPGMA method. The tree is drawn to scale, with branch lengths corresponding to the Cα RMSD (Å) of the pairwise structural alignments. Branches are labeled according to the calpain paralog structures with respective PDB IDs in parentheses. The corresponding sequence-based tree is shown in the inset.
(B) Superimposition of PC1 structures used to construct the phylogenetic tree. Calpain structures are colored by their respective clustering in the phylogenetic tree.
(C) Structure-based phylogenetic tree of calpain PC2 domains.
(D) Superimposition of PC2 structures.
(E) Sequence logo diagrams showing the amino acid distribution in the PC1L1, PC2L1, and PC2L2 loops. The x axis lists the corresponding position in human CAPN5-PC. The height of each position is proportional to its conservation (among 454 CAPN5 sequences) and the height of the letter to its frequency at that position.

