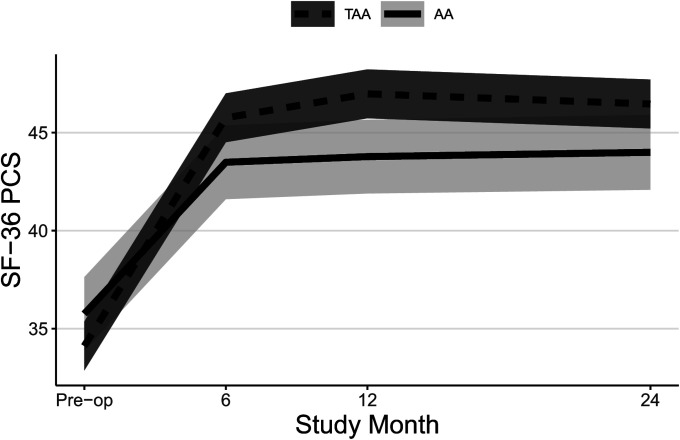
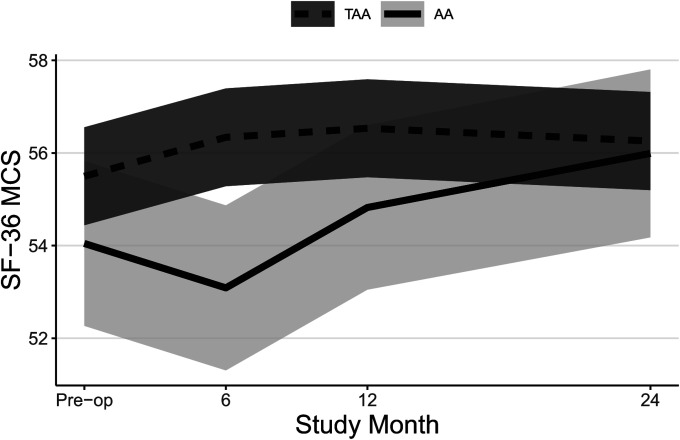
Figs. 3-A and 3-B Mean trajectory for SF-36 PCS (Fig. 3-A) and SF-36 MCS (Fig. 3-B) scores by study visit and surgery type with 95% CIs. Estimates were obtained from linear mixed effects regression of outcome on study visit, surgery type, and visit-by-surgery type interaction. All models included confounders of age, sex, and BMI. Additional confounders included employment, a history of depression and/or anxiety, and current smoking for SF-36 MCS.

An official website of the United States government
Here's how you know
Official websites use .gov
A
.gov website belongs to an official
government organization in the United States.
Secure .gov websites use HTTPS
A lock (
) or https:// means you've safely
connected to the .gov website. Share sensitive
information only on official, secure websites.

