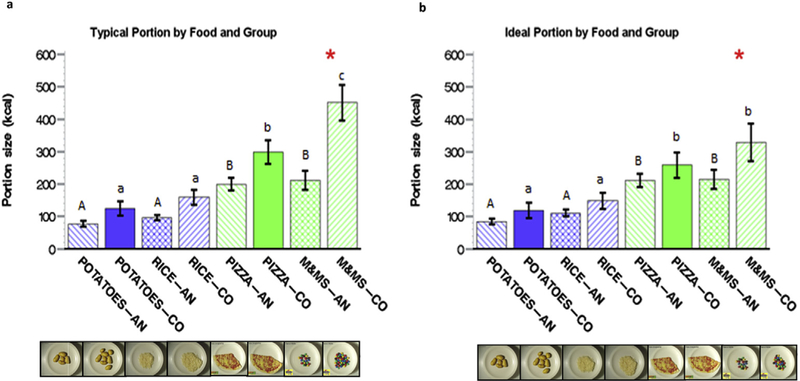
Fig. 1.
Typical (a) and Ideal (b) Portion Size Selected in kcal. The portions corresponding to each food are shown on the bottom. AN represents anorexia nervosa patients. CO represents healthy controls. Asterisk represents p-value < 0.05 for difference between groups for the same food. Uppercase letters compare differences between foods within AN patients. Lowercase letters compare differences between foods within healthy controls. Foods labeled with the same letter are statistically similar (p-value > 0.05).

