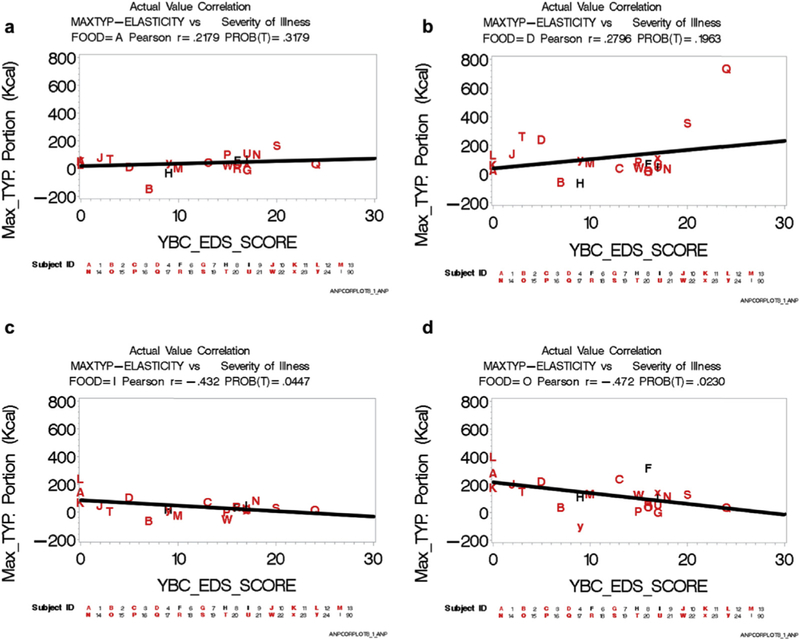
Fig. 3.
Regression of Elasticity and Severity of Illness for each food. Each individual participant is represented by a letter and corresponds with a Subject ID as shown on the bottom of each figure. Each figure represents a different food a) Potatoes b) Rice c) Pizza d)M&M’s. Participants labeled with letters “H”, “F”, and “I” are AN-P. The only male is represented by the letter “D”. Regression statistics are tabulated above each panel.

