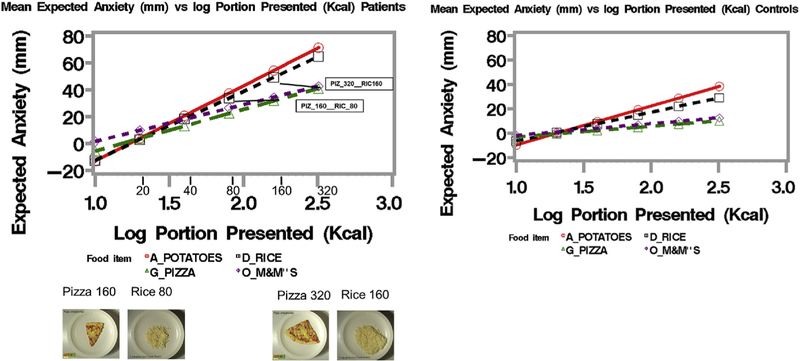
Fig. 2.
Mean stress-slopes for each food. Left panel show patients, right panel controls. Each line is the mean of the individual slopes and intercepts from each participant for each food. Note that lines connecting points with the same stress level but different energy levels are represented by portions of foods corresponding to these energy levels shown at the bottom. It should be clear that the lines connect portions that are approximately the same physical area, but different in energy content. The smaller comparison (160 kcal pizza = 80 kcal rice) is shown on the left and larger (320 pizza = 160 rice on the right). Note the stress slopes for controls on the right are all lower than for patients. Statistics of all regression lines are shown in Table 5. Axis label for the abscissa is shown in both log and additive units so that the linear log relationship of expected anxiety to energy content is clear in relation to the actual stimulus energy contents.

