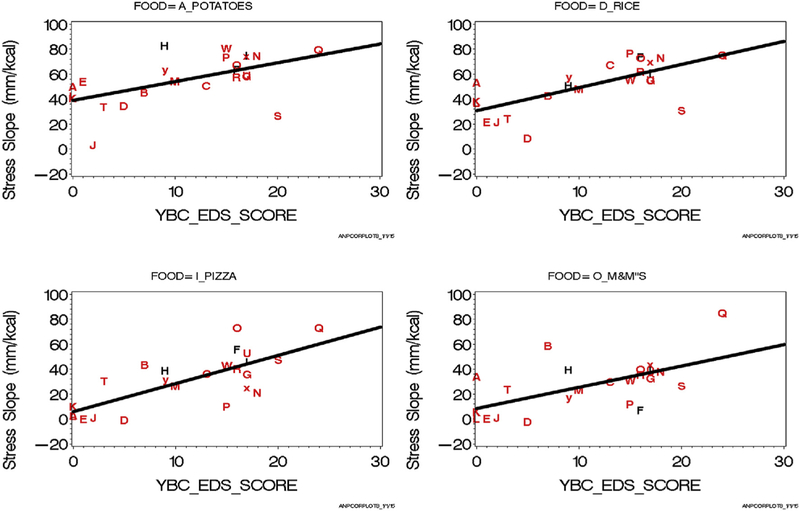
Stress-slope regressed from YBC-EDS score for patients. Each panel shows the relationship for each food, and individual participants are shown by the same letter across foods. Axis label for the abscissa is shown in both log and additive units so that the linear log relationship of expected anxiety to energy content is clear in relation to the actual stimulus energy contents. Participants labeled with capital letters “H” “F” and “I” are anorectic-purgers. The lone male is “D”. Regression statistics are tabulated below.
| FOOD |
INTERCEPT ± SE |
P_INT |
SLOPE ± SE |
SLOPE_PROBT |
R-SQUARED |
| A_POTATOES |
39.10 ± 6.18 |
<.0001 |
1.51 ± 0.47 |
0.0040 |
0.32 |
| D_RICE |
30.63 ± 5.44 |
<.0001 |
1.85 ± 0.41 |
0.0002 |
0.48 |
| I_PIZZA |
5.78 ± 5.65 |
0.3180 |
2.26 ± 0.43 |
<.0001 |
0.56 |
| O_M&M″S |
8.30 ± 6.31 |
0.2020 |
1.72 ± 0.48 |
0.0020 |
0.37 |

