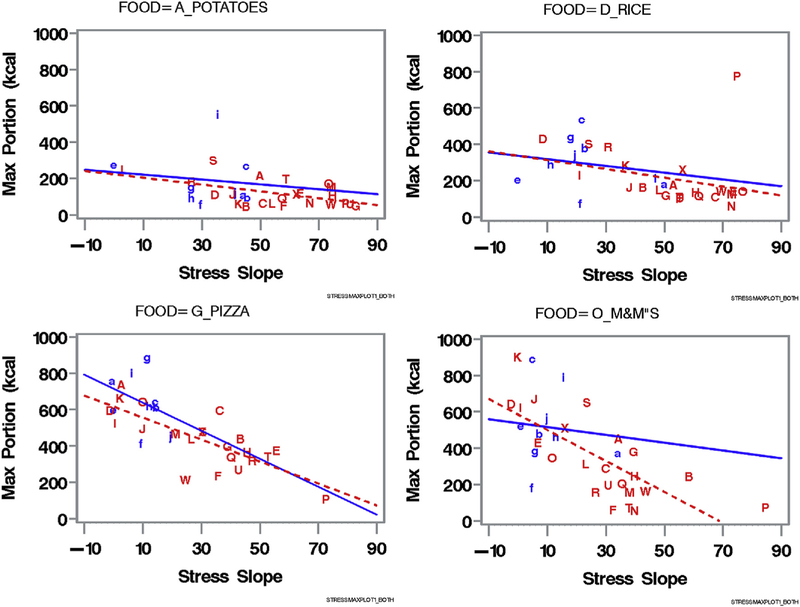
Fig. 4.
Regressions of maximum tolerated portion size predicted from stress-slope as portions increased. One panel is shown for each food. Each letter shows the same participant on each plot so the relative positions across foods can be compared. Patients are lower case, solid line; controls are uppercase dotted line. Males are identified with letters “a” and “e” for controls and “D” for patients. Participant codes are:  The regression statistics for the foods are as shown in Table 5.

