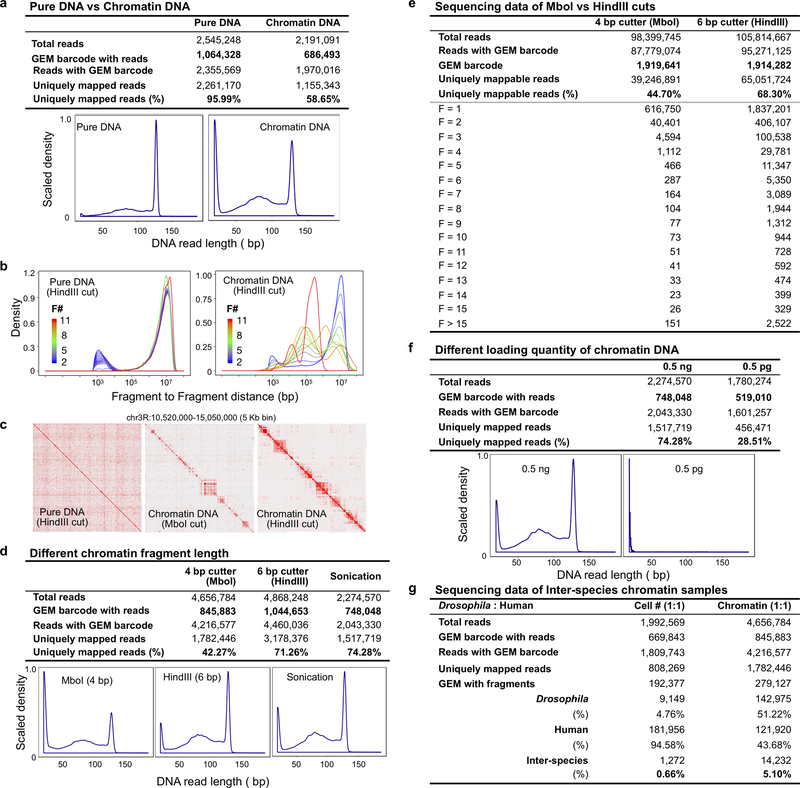
Extended Data Figure 1. ChIA-Drop method optimization.
The efficiency of the microfluidics system for chromatin DNA barcoding and amplification was characterized by MiSeq sequencing data, where each test generated 2–4 million sequencing reads. The numbers of captured GEM barcodes, the percentages of uniquely mapped reads, and the read length distribution are presented for data quality assessment.
a Pure DNA versus chromatin DNA. Both pure DNA and chromatin DNA templates were prepared from the same chromatin sample. The chromatin sample was prepared by in situ HindIII digestion followed by sonication for nuclear lysis. The chromatin DNA used for test was still in crosslinked state, and some DNA positions were bound by protein component. The pure DNA was purified from the chromatin fragment after de-crosslinking. The length of the DNA templates was about 3,000 bp. Most of the pure DNA sequencing reads were in maximum length (130 bp), of which 96% were mappable. The chromatin DNA yield 59% mappable reads.
b Distance density comparison of pure DNA and chromatin DNA. The relative probability densities of the log10 of fragment-to-fragment distances in a GEM are plotted, categorized by the fragment number per GEM (F#), color code blue-green-red for fragment F=2, F=3, up to F=11. Both pure DNA (left) and chromatin DNA (right) data are plotted on the same color scale. To be noted, the low-fragment-containing GEMs showed the similar distributions as the pure DNA, whereas the chromatin DNA with high-fragment-containing GEMs displayed different patterns.
c 2D heatmap comparison of pure DNA (HindIII, 6-bp cutter), chromatin DNA (Mbol, 4-bp cutter and HindIII). The pure DNA data show random interactions and lack chromatin topological structures; the Mbol chromatin DNA data exhibit little structures, and HindIII chromatin DNA data show rich chromatin contact structures.
d Chromatin fragment length by different fragmentation methods. Chromatin sample digested by 4bp-cutter (MboI, ~300 bp) or 6bp-cutter (HindIII, ~3,000 bp), or sheared by sonication (~6,000 bp) were prepared accordingly. The longer chromatin fragments (3,000–6,000 bp) generated more mappable DNA sequencing reads (≥50 bp) than the shorter fragments.
e Summary statistics of GEMs from chromatin libraries prepared by Mbol and HindIII digestion. The read statistics between the two libraries are comparable under the same loading amount, but the fragment histograms of GEMs are different. The HindIII data generated more uniquely mappable reads and more high-fragment-containing GEMs than the Mbol data, contributing to the chromatin structures shown in (c).
f Chromatin sample loading by different input quantity. Input chromatin DNA of 0.5 ng yield optimal results. When input was too low (i.e., 0.5 pg), the majority of the sequencing reads were only 19–20 bp (barcode primer sequence), indicating that most droplets lack chromatin materials.
g Inter-species chromatin experiment. Chromatin samples of Drosophila S2 and human GM12878 cells were mixed in equal number of cells or in equal quantity of chromatin DNA. Barcoded sequencing reads were mapped to each reference genome. Reads with the same GEMbarcode were grouped as a GEM. GEMs with fly-only, human-only, or mixed reads were identified. The ratio of mixed GEMs over the total GEMs is an approximate likelihood of a mixed chromatin complex in a droplet. When tested with equally mixed numbers of cells, the number of GEMs with chromatin fragments of human origin is 20-fold more than GEMs of Drosophila origin (181,956 / 9,149 = 19.89), which reflect the ratio of human to Drosophila genome lengths (hg 3,000 Mb / dm 175 Mb = 17.14). Notably, in the test with equal chromatin mass, the GEMs with mixed origins of fragments were only 5.1%, indicating a small proportion of droplets with mixed chromatin samples.

