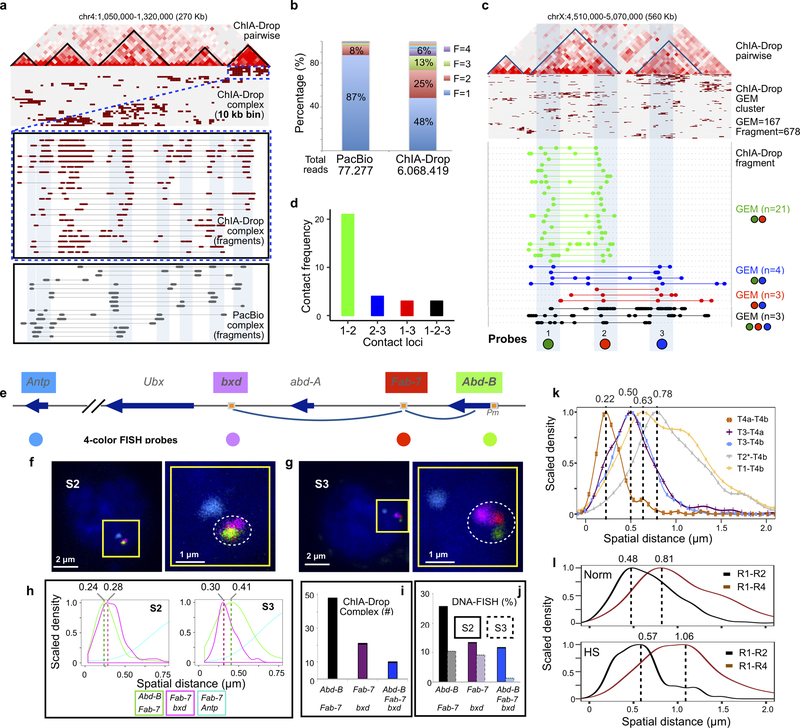
Extended Data Figure 3. Technical validation of ChIA-Drop data.
a Comparison of ChIA-Drop and PacBio detected multiple chromatin complexes. In a given 270 Kb window, a linear fragment view of ChIA-Drop data shows clusters associated with TAD structures. A zoomed-in view displays the overlapping chromatin fragments from ChIA-Drop and PacBio complexes, with matching regions highlighted in light blue. Both complex data exhibit high level of heterogeneity.
b Comparison of distributions of fragment number in chromatin complexes in PacBio and ChIA-Drop data. Both methods captured multiplex chromatin complexes at a single-molecule resolution. Under the same cost, PacBio sequencing generated less number of reads than ChIA-Drop sequencing using Miseq. With more reads, ChIA-Drop data show higher multiplexity in chromatin contacts than PacBio data.
c ChIA-Drop data of chromatin contacts with multiple fragments were shown in pairwise 2D contact map, complex cluster, and fragment views in this region. The same region was studied by Szabo and colleagues15 using 3D super-resolution DNA-FISH (3D-SIM), with three probes (1 ‘green’, 2 ‘red’, 3 ‘blue’) designed to test intra-TAD contacts (probe 1–2) and inter-TAD contacts (probe 1–3, 2–3, and 1-2-3). ChIA-Drop detected all combinations possible pairwise and 3-way contacts, and the number of GEMs are noted as n.
d ChIA-Drop contact frequencies between the 3 loci are plotted. The highest contacts were between the intra-TAD loci 1 and 2, and the 3 other combinations of inter-TAD were low approximately at the same level. The intra-TAD and inter-TAD contact frequencies matched with the physical distances of the three loci as measured by 3D-SIM. More specifically, individual GEMs contained fragments that overlap the 3 probed loci were detected, validating ChIA-Drop for detecting multiplex chromatin contacts.
e Diagram of Hox genes cluster BX-C (bithorax complex, comprises three Hox genes, Ubx, abd-A, and Abd-B). The pairwise chromatin contacts between Fab-7/Abd-B and Fab-7/abd-A were shown by 2-color FISH in S2 cells but not in S3 cells. The three loci, bxd, Fab-7 and the Abd-B promoter (Pm), were used to make fluorecent DNA probes as shown. Fab-7 and bxd are separated by approximately 130 kb, Fab-7 and Abd-B Pm by approximately 70 kb. Gene Antp in another Hox gene cluster ANT-C (Antennapedia complex) approximity 10 Mb away from BX-C was also included for a fluorecent probe to provide a nuclear position point in FISH experiment. An arrow indicates gene orientation, square with orange color indicates promoter regulatory elements (PRE), and the colored circle dots represent DNA probes with corresponding colors.
f Four-color FISH in Drosophila S2 cells. The three loci (Abd-B, Fab-7, and bxd; n=20, measured in 179 nuclei from two independent biological replicates) were colocalized, and the probe for Antp locus provided spatial nuclear position. The scale bar is either 2 μm or 1 μm as indicated. Right side is zoom-in view of the left side.
g Four-color FISH in Drosophila S3 cells. The three loci (Abd-B, Fab-7, and bxd; n=1, measured in 76 nuclei from two independent biological replicates) were notably not colocalized, revealing topological structure of of this Hox gene cluster. Same as in S2 cell, the probe for Antp locus provided spatial nuclear position.
h Curves of spatial distances (μm) between pairs of probes measured by Imaris image analysis software v9.2. The modes of the distances of Abd-B to Fab-7 is 0.24 μm in S2 cells (n = 179) and 0.41 μm in S3 cells (n = 76); the modes of the distances of Fab-7 to bxd is 0.28 μm in S2 cells (n = 179), and 0.3 μm in S3 cells (n = 76). In both cells, the modes of the distances of Fab-7 to Antp, are larger than 1.81 μm.
i Histogram displays the ChIA-Drop-identified chromatin contacts at the Hox gene locus between Abd-B to Fab-7, Fab-7 to bxd, and Abd-B to Fab-7 to bxd together simultaneously.
j Histogram displays proportions of nuclei that were detected colocalization at loci between Abd-B to Fab-7, Fab-7 to bxd, and Abd-B to Fab-7 to bxd together simultaneously. With spatial distance cutoff of 0.24 μm, the more nuclei colocalized in S2 cells (n = 179) than in S3 cells (n = 76).
k Distributions of spatial distances (μm) between pairs of probes, measured using the Imaris image analysis software. The modes of the distance distributions for each pair of probes are as follows: T4a-T4b, mode Mo = 0.22 (nuclei, n = 221); T3-T4a, Mo = 0.5 (nuclei, n = 221); T3-T4b, Mo = 0.5 (nuclei, n = 404); T2*-T4b, Mo = 0.78 (nuclei, n = 404); T1-T4b, Mo = 0.63 (nuclei, n = 404).
l Spatial distances (μm) of probe pairs in normal S2 cells (n = 213) and heat-shock (HS) treated cells (n = 150), analyzed using the Imaris image analysis software. Upper panel, distributions of spatial distances in the normal, untreated cells (n = 213). The modes of spatial distance distributions for each of the probe pairs are: R1-R2, mode Mo = 0.48; R1-R4, Mo = 0.81. Lower panel, curves of spatial distances in the heat-shock treated cells (n = 150). The modes of spatial distance distributions for each of the probe pairs are: R1-R2, Mo = 0.57; R1-R4, Mo = 1.06. The spatial distances of R1-R2 and R1-R4 observed in HS treated cells were notably larger than in untreated normal cells.

