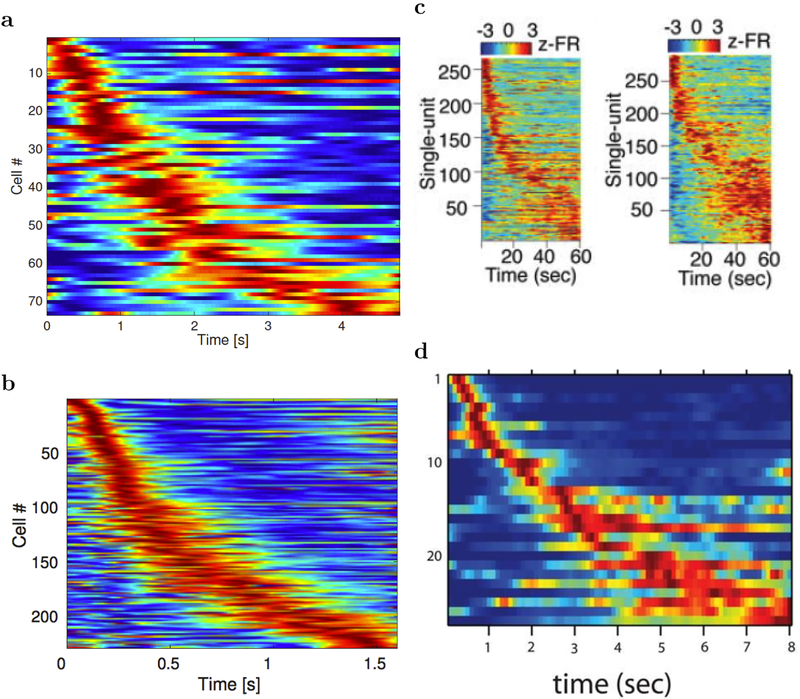
Figure 1. Sequentially activated neurons in the brain.
Each row on each heatplot displays the normalized firing rate for one time cell. Red corresponds to high firing rate, while blue corresponds to low firing rate. The cells are sorted with respect to the median of the spike time in the delay interval. Two features related to temporal accuracy can be seen from examination of the heatmaps. First, time fields later in the delay are more broad than time fields earlier in the delay. This can be seen as the widening of the central ridge as the peak moves to the right. In addition the peak times of the time cells were not evenly distributed across the delay, with later time periods represented by fewer cells than early time periods. This can be seen in the curvature of the central ridge; a uniform distribution of time fields would manifest as a straight line. a. After Tiganj, et al., in press. b. After Tiganj, et al., 2017. c. After Bolkan et al., 2017. d. After MacDonald et al., 2011.

