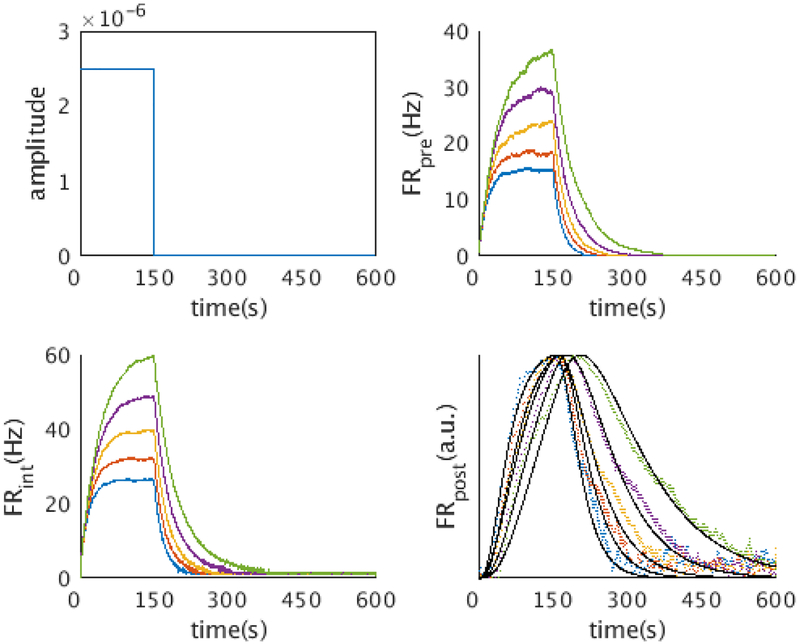
Figure 8. The network implements the Laplace transform and inverse for a temporally extended stimulus.
We simulated the network activity with a square wave input (top left). The network activity agrees with the theoretical prediction from the mathematical framework. The layer I neurons and the layer II neurons exhibit the activity of a charging capacitor (5 representative layer I neurons, top right; 5 representative layer II neurons, bottom left). The firing rates of time cells (bottom right, 5 representative time cells shown) agree with the prediction from the mathematical framework (black line)

