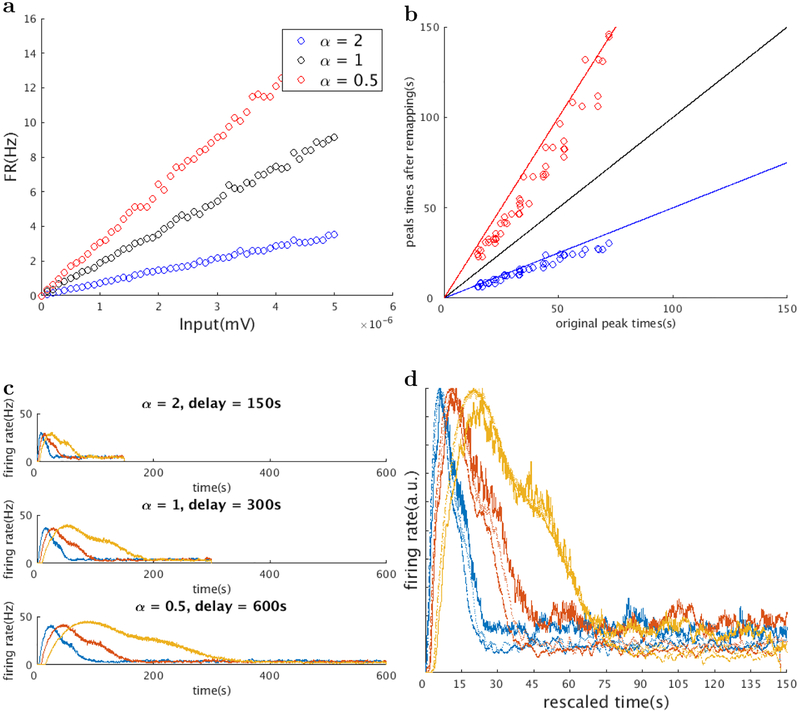
Figure 9. Rescaling of time cell firing rates by a global change of the slope of the f-I curves.
We simulated the “time rescaling” phenomenon described in MacDonald et al., 2011, where the firing fields of time cells are rescaled according to the length of the delay interval. We globally changed the slopes of the f-I curves of all the layer I cells by means of changing the maximum CAN current conductance (a, three f-I curves of the same layer I cells when the delay interval is changed to half (blue), twice (red), and the same as the original). This results in the rescaling of the peak times of all the time cells (b, red: peak times become twice the original, blue: peak times become half the original. Three straight lines indicate y = 0.5x(blue), y = x(black) and y = 2x(red)). Firing rates of 3 representative time cells are shown in c (before remapping (c,top), when the delay interval is changed to one half (c,middle) and twice (c,bottom) of the original, same color indicates the same cell). The firing rates of the same time cell under different delay lengths coincide when the time axis is rescaled according to the peak times (d). Color indicates the same cell in (c), thick line: α = 2, dotted line: α = 1, thin line: α = 0.5)

