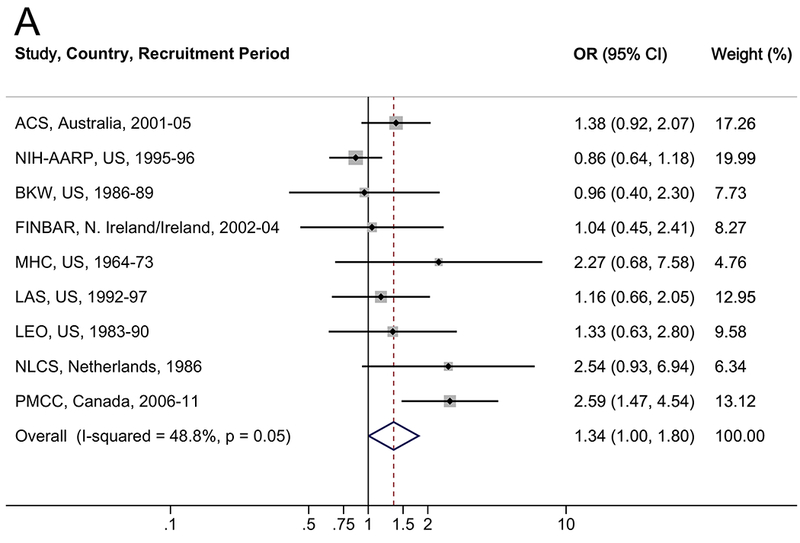
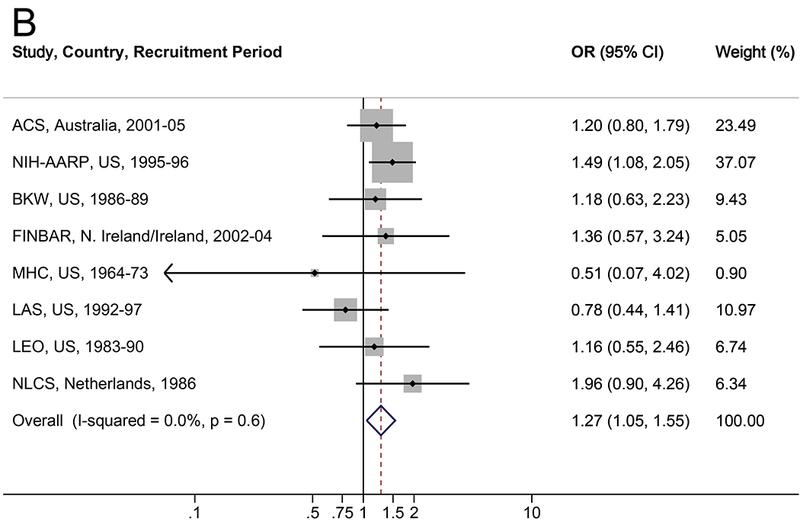
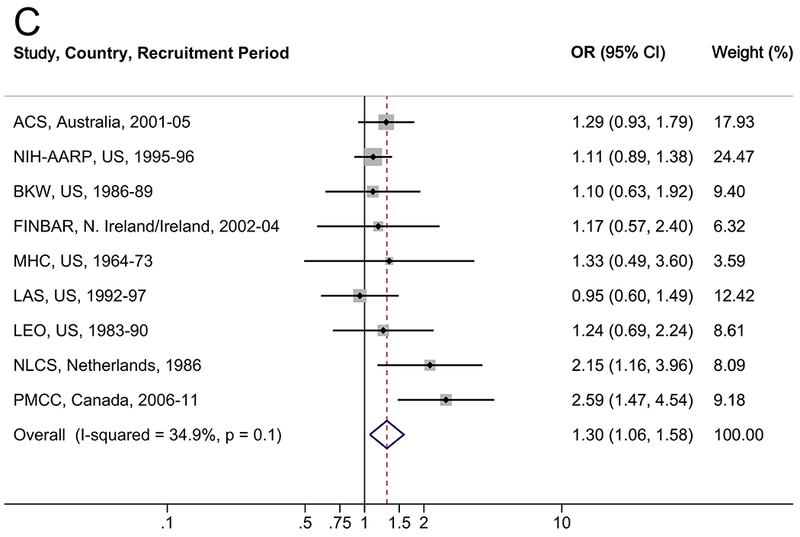
Figure 1.


Forrest plot of the relationship between diabetes and (A) esophageal adenocarcinoma, (B) esophagogastric junction adenocarcinoma, and (C) all esophageal and esophagogastric junction adenocarcinomas, by random effects model adjusted for age, sex, smoking (never, ever), and body mass index (continuous).
