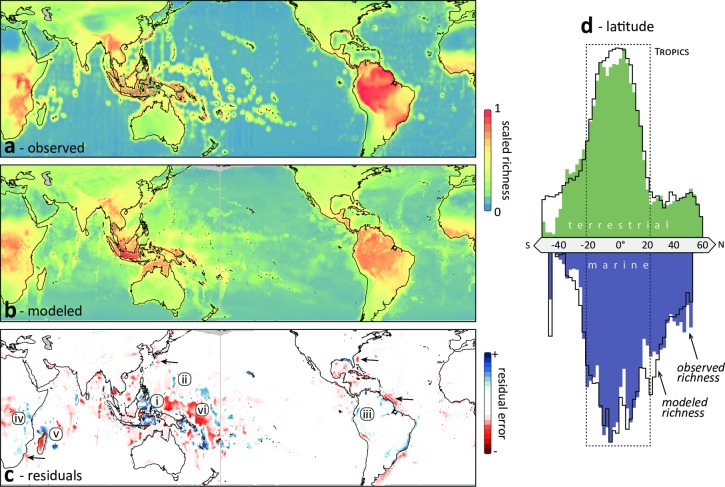
Fig 1. Global terrestrial and marine biodiversity patterns.
(a) Observed species richness derived from the distributions of 44,575 marine and 22,830 terrestrial species. Species richness is ln-transformed and rescaled within each domain (terrestrial and marine) and plotted on a 50 km equal area grid. (b) Artificial neural network model predictions (ANNs) of species richness considering a suite of 29 environmental drivers. (c) Model residuals highlight areas that are particularly species-rich (underpredicted, blue) and species-poor (overpredicted, red) regions relative to the underlying environmental drivers. These highlight locations of exceptional biodiversity such as reef ecosystems of the (i) Coral Triangle and (ii) Marianas Archipelago and wet forests of the (iii) tropical Andes and (iv) Eastern Arc mountains. It also identifies species-poor settings like isolated islands (v, Madagascar) and major biogeographic boundaries in the ocean (vi, Andesite line). Arrows designate species-poor marine regions with high velocity boundary currents. (d) Latitude does not affect model performance, as there are no systematic meridional differences between observed and modelled richness. The northern-hemisphere bias of land, and the corresponding abundance of shallow ocean environments, generates a similar imbalance of marine species richness. Chart area represents the average species richness, zonally, in 2° latitude bins.

