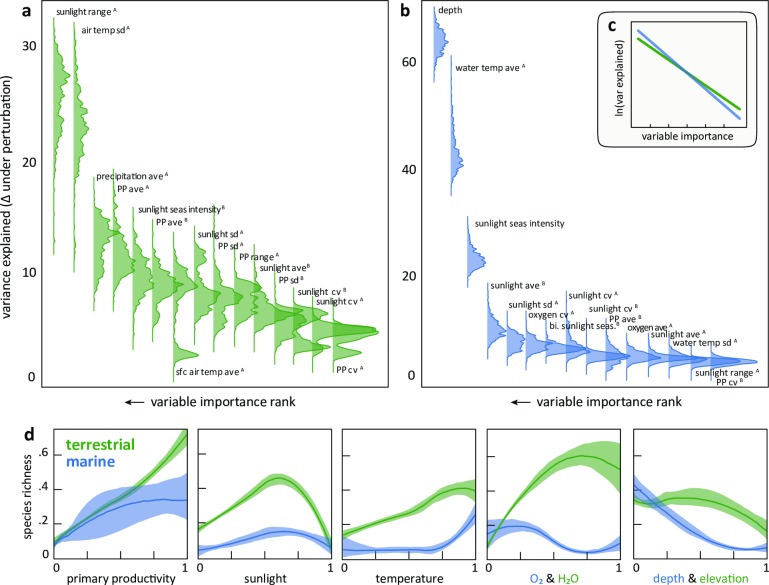
Fig 2. Environmental drivers of species richness in marine and terrestrial domains.
The ranked importance of the top 15 environmental variables in the (a) terrestrial and (b) marine ANNs. Bootstrapped driver variable importance plots display the densities of change in explained variance made when perturbing individual model factors. The process is repeated 500 times with a random subset of the data on which a new ANN model is trained, generating a robust importance ranking by allowing multiple weight matrices to be evaluated as to how they learn the driver-richness relationship. On the variable labels, “A” is measured within year, “B” is between years. (c) Inset plot shows these same relationships on a log-linear scale, highlighting the steeper decline of variable importance and therefore greater effect of fewer variables in marine systems. (d) Pairwise plots showing the effects from a subset of individual drivers on species richness. To alleviate overplotting, graphs display the median ensemble (with 95% quantiles) of 100 local regression models fit from resamples of the global dataset. For (d) all variables are annual means and rescaled to 0–1 without further transformation. Similar factors are plotted when the same do not exist in both domains. Supporting information provide the full list of all modelled variables and their explanation.

