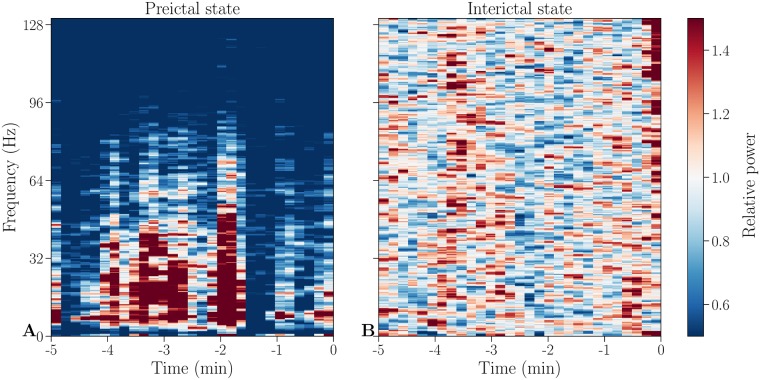
Fig 1. Example spectrograms of preictal and interictal states.
Baseline corrected spectrograms of a preictal (A) and an interictal (B) individual measurement period of channel HR1 from patient 1. This channel and individual measurement period will be used throughout the paper for illustrative purposes, if not stated otherwise.

